You open an AI stock picker, type in a company you have been watching, and it comes back with a 10 out of 10 and a green Strong Buy. It feels like an answer. It is really a position in a queue: an AI stock picker ranks every stock in its universe by how likely the model thinks each one is to beat a benchmark over a fixed window, usually one to three months. The score tells you where your stock sits in that ranking. It does not tell you what your stock will do.
That gap between a rank and a forecast is where most of the confusion lives. This post walks through what the score is built from, what the people who make these scores say about them in their own documentation, what the academic research found, and what happened to an AI-run fund that ran the experiment in public for nine years.
What an AI Stock Picker Actually Does
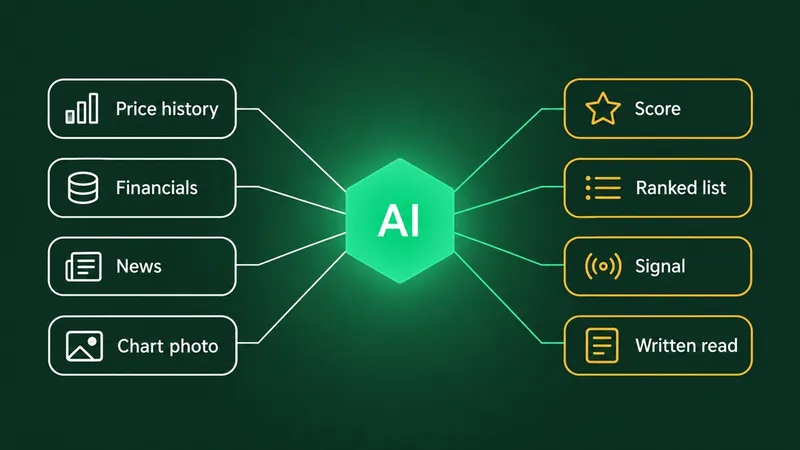
Strip the branding away and every AI stock picker does the same three things. It collects a large set of inputs for every stock it covers: price trends, volume, valuation ratios, earnings revisions, news and sentiment. It trains a model on how stocks with similar inputs behaved over the following weeks or months. Then it scores today's stocks against that history and sorts them.
Danelfin, one of the better documented examples, describes its AI Score as a rating from 1 to 10 built from more than 900 daily indicators per stock (about 600 technical, 150 fundamental and 150 sentiment), turned into over 10,000 features. Its own FAQ says the score comes from an ensemble of roughly 500 gradient-boosted decision trees, and its help pages say the US model learns from the latest 252 market days.
The output is a probability, then a bucket. A 7 to 10 is labelled Buy or Strong Buy, a 4 to 6 Hold, and a 1 to 3 Sell or Strong Sell. The label is a translation of a ranking, not a separate judgement about the company.
Why the window matters
Every score is tied to a horizon. Danelfin's is three months against the S&P 500. A score that says "likely to beat the index over the next quarter" says nothing about the next week, and nothing about the next five years. If you hold stocks for years, a picker tuned to 90 days is answering a question you did not ask.
Three Picker Scores Side by Side
The scores look alike on screen, which hides how differently they are built. Here is what each publisher says about its own number, as published on their sites.
| Score | Scale | What it estimates | Window | Built from |
|---|---|---|---|---|
| Danelfin AI Score | 1 to 10 | Probability of beating the S&P 500 | 3 months | 900+ technical, fundamental and sentiment indicators |
| Kavout K Score | 1 to 9 | Probability of the stock going up | 30 days | Machine learning over many data sources (as Kavout described it in 2018) |
| Zacks Rank | #1 to #5 | Timeliness, Strong Buy to Strong Sell | 1 to 3 months | Earnings estimate revisions, "purely mathematical" |
| Primo Trade Primo Score | 0 to 100, five scores | The AI's read of one stock or chart | None stated | Prices, news and metrics for a ticker, or the chart in a photo |
Two things stand out. The Zacks Rank is not sold as AI at all, yet it has the same shape: five buckets from Strong Buy to Strong Sell, a short window, a ranking underneath. The Zacks about page traces it to research first published in 1979 on how analysts' earnings estimate revisions move prices. "AI" is often a new engine under an old ranking idea.
The second is the last row, which is the publisher's own product and a different kind of thing. More on that further down.
A 10 Out of 10 Is a Rank, Not a Promise
The most common misreading is treating a top score like a grade on a test, as if 10 out of 10 meant "this will work". It means "of all the stocks we scored today, this one looks most like the stocks that beat the index in our training window".
Higher than average is not high
Danelfin's own wording is careful here. It says stocks scored 7 to 10 have an above-average probability of beating the market, and that its AI "calculates probabilities, not certainties". Above average is a relative claim: better odds than the typical stock on the list, not good odds in any absolute sense. That kind of tilt is a real edge for someone holding hundreds of positions, and a thin one for someone holding one.
The scale is not a percentage
A 9 out of 10 is not a 90% chance of anything, and a 1 out of 10 is not a 10% chance. The numbers are bucket labels on a sorted list. The same applies to any 0 to 100 score: 80 out of 100 is a position on a scale, not an 80% probability.
What the Research Says About Picking Stocks With Machine Learning
The best known academic test of this idea is a 2020 paper by Shihao Gu, Bryan Kelly and Dacheng Xiu in the Review of Financial Studies, which compared many machine learning methods on the full US stock market. It is often quoted as proof that AI picks stocks well. What it found is more interesting than that.
For individual stocks, their three-layer neural network explained about 0.40% of the variation in next month's stock moves, out of sample, over a test period from 1987 to 2016. A plain linear regression on the same inputs came in below zero, at -3.46%. So the machine learning model was far better than the old method, and still explained less than half of one percent of what any single stock did in a month.
Where the edge shows up
The edge appeared when the model's forecasts were used to sort thousands of stocks into groups, buying the top tenth and shorting the bottom tenth. Spread across that many positions, tiny per-stock signals added up to a strong result on paper. The authors also found that the most useful inputs were price trends, liquidity and volatility, which are the same raw materials any chart reader looks at.
That is the honest summary of what an AI stock picker can do: a small, real tilt across a large basket, and very little certainty about any one name.
The AI Fund That Ran the Experiment in Public
In October 2017 an exchange-traded fund launched with a simple pitch: let an AI pick the stocks. The AI Powered Equity ETF, ticker AIEQ, follows an index built by EquBot's model on IBM Watson, which reads news, financial statements, analyst reports and market data on thousands of US companies and picks a portfolio from them. Amplify ETFs runs it today, with 161 holdings on its latest fact sheet and a 0.75% expense ratio.
It is a useful test because it is public, daily and long. An analysis by CXO Advisory compared it with the SPDR S&P 500 ETF from its first trading days in October 2017 to September 2023. The AI fund averaged 0.035% a day against 0.047% for the index fund, with a beta of 1.02, meaning it moved slightly more than the market while doing slightly worse.
Nine years in
The fund kept going. By NAV it fell 31.57% in 2022, according to its Vanguard profile page. Amplify's own page puts its annualized result since inception at 9.37% by NAV as of 31 October 2026. None of that says AI is useless for picking stocks. It says that a model which looks sharp in a backtest still has to survive real fees, real trading and markets that stop behaving like the training data.
Why One Stock Is the Hardest Case
Here is the part most marketing leaves out, and it comes from a picker's own documentation. Danelfin's audit FAQ calls the AI Score "a probabilistic, statistical edge" that "works best across a basket of stocks, not as a conviction signal for one position." It compares the score to a casino edge: the house wins over many bets, not on every hand.
That is the right way to read every AI stock picker score. If you look up one stock you already like and see a high score, you have learned that the model ranks it well today. You have not learned that it will beat the market this quarter, and the model's makers do not claim you have.
The single-stock trap
The trap gets worse when you shop for a score. Check three pickers, find the one that rates your stock highest, and you have selected the most flattering opinion rather than the most informed one. The scores disagree for real reasons: different inputs, different windows, different benchmarks. A disagreement between them is information, not noise to be averaged away.
Best AI Stock Picker? Five Questions to Ask First
Search for the best AI stock picker and you will find lists ranked by people who are often selling one of the entries. Regulators have noticed the gap between AI claims and AI reality. In March 2024 the SEC settled charges against two investment advisers, Delphia and Global Predictions, for claiming to use AI in ways they did not, with penalties of $225,000 and $175,000. The SEC chair called it "AI washing". A joint investor alert from the SEC, NASAA and FINRA in January 2024 told investors to be cautious about using AI-generated information to predict the market's direction or a stock's price.
Before you trust any picker's score, ask:
- What exactly does the number estimate? Beating an index, going up at all, or something vaguer? If the site does not say, the number means nothing.
- Over what window? A 30-day score and a 3-month score can disagree about the same stock and both be doing their job.
- Against which benchmark? Beating the S&P 500 is a different bar from beating cash.
- Is the track record audited, or written by the seller? A backtest on the publisher's own page is a claim, not evidence.
- Does the publisher say it works for single stocks? Several, as above, say plainly that it works across baskets.
If you want to see how the main tools differ on these points, we put AI stock analysis tools side by side in an earlier post.
Where Primo Trade Fits
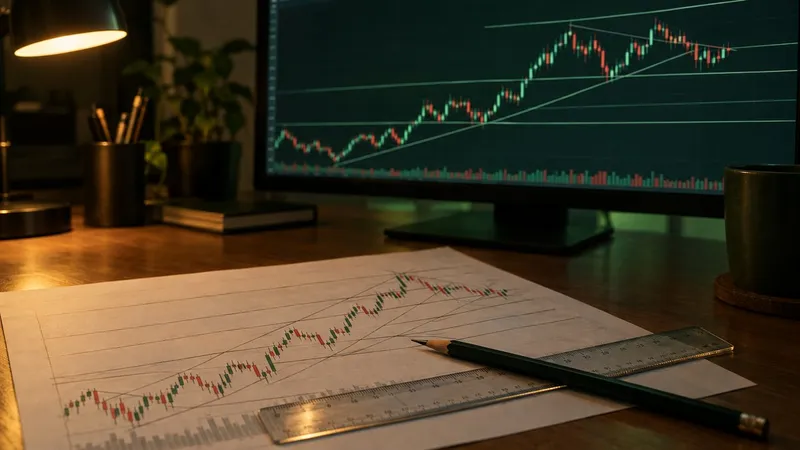
Primo Trade is our own app, and it is not an AI stock picker. It does not scan or rank the market. It reads one stock or one chart that you bring to it, either from a US-listed ticker or from a photo or screenshot of a chart, and gives an AI analysis of that one thing.
Its Primo Score is a radar of five scores from 0 to 100: Risk, Sentiment, Technical, Fundamental and Growth, with a short summary. Those are the AI's read of the data in front of it, not a probability, so a Technical score of 80 is not an 80% chance of the price rising. The result also carries a signal from Strong Buy to Strong Sell, which is the AI's directional read, not an instruction, and for ticker analyses a Forecast Value, the model's 6 to 12 month estimate, which we unpack in a post on AI predictions and analyst targets.
Primo Trade gives AI-generated analysis for information and education. It is not financial advice. Markets carry risk; do your own research before you trade.
The useful job for a single-stock read like this is a second opinion that shows its working: which part of the chart, the news or the numbers pushed the read one way, so you can check it against your own.
What a Picker Score Can Tell You
An AI stock picker score is a ranking of many stocks against a benchmark over a short, fixed window. A 10 out of 10 means "near the top of today's list", not "will rise", and the scale is not a percentage.
The research behind these tools found a real but small signal per stock that adds up across thousands of positions. The most public AI-run fund trailed a plain index fund over its first six years. The makers of at least one leading picker say in writing that their score works across baskets, not as conviction for a single position.
Read the score for what it is: one input, with a stated window and benchmark, that tells you how a model ranks a stock today. The decision about the one stock you hold is still yours to research.