You pull up a stock and see two numbers for a year from now. The analyst consensus target says $140. An AI stock prediction on another site says $112. The stock trades at $118, so one number points up, the other points down, and both look precise to the dollar.
Here is the short answer. An analyst price target and an AI stock prediction are both point estimates of a future price, and the published record says neither lands on its point very often. A target is a valuation a person builds from earnings estimates and a multiple, inside a set of disclosure rules. An AI prediction is what a statistical model pulls out of past prices, fundamentals and news. They go wrong in different ways, and knowing how each one goes wrong is what makes them useful.
This post puts the two side by side: what each is built from, how often analyst targets were reached in published studies, what machine learning research found when it tried to call single stocks, and what to do when the two disagree.
AI stock prediction vs analyst price targets at a glance
| Analyst price target | AI stock prediction | |
|---|---|---|
| Made by | A sell-side analyst at a bank or broker | A statistical or machine learning model |
| Built from | Earnings estimates, a valuation multiple or a cash flow model | Past prices, volume, fundamentals, news text |
| Horizon | Usually 12 months | Anything from a day to a year, set by the vendor |
| Shown as | One price, next to a rating | One price, a range or a probability |
| Rules on it | US research rules ask for a stated basis and risks | No rule on how the number is built |
| Leans | Above the current price, on average | Towards the years it was trained on |
Neither column has a row for "will be right". That row would be blank in both.
The rest of this post fills in the table, starting with the number most investors have seen longest.
What an analyst price target is
A price target is the price an analyst expects a stock to reach, usually within 12 months, published in a research report beside a rating such as Buy or Hold. When a quote page shows a "consensus target", it is the average or median of the targets from every analyst who covers the stock.
Most targets come from one of two routes. The analyst estimates future earnings per share and multiplies by the price-to-earnings multiple they think the market will pay, or they discount projected cash flows back to today. Both start from an earnings forecast, which is why targets move when estimates do. If the earnings figures themselves are confusing, it helps to know why one quarter has three EPS numbers before you lean on a target built from them.
In the US, a target lives inside a rulebook. FINRA Rule 2241 requires that any price target in a research report has a reasonable basis, comes with a clear explanation of the valuation method, and fairly presents the risks that could stop it being reached. Once a firm has kept a target on a stock for a year, its reports must also carry a price chart marking every date the target or rating changed.
So the track record of a firm's targets is, in principle, printed on its own reports. Few readers look at it.
How often analyst price targets are reached
Two well-known studies measured this directly.
Paul Asquith, Michael Mikhail and Andrea Au studied 818 price targets issued between 1997 and 1999 by analysts who had made a "First Team" ranking between 1996 and 1999. In their NBER working paper, about 54% of the targets were reached or exceeded at some point in the following 12 months. The other 46% got, on average, to 84% of the target.
Mark Bradshaw, Lawrence Brown and Kelly Huang then took a far larger sample: 12-month targets from the I/B/E/S database between 2000 and 2009. Their published study in the Review of Accounting Studies found that 64% of targets were met at some time during the 12 months, but only 38% were met at the end of them. The average absolute forecast error was 45%.
The gap between 64% and 38% is the part that matters to you. A stock that touches its target in month seven and slides back by month twelve counts as a hit in the first number and a miss in the second. If you read a target as "where the stock will be in a year", 38% is the figure that answers that question.
The optimism built into targets
Targets lean high. In the Bradshaw, Brown and Huang sample, the upside the targets implied exceeded the move the stocks actually made by an average of 15%. A study of UK-listed stocks in Accounting and Business Research, covering 201,200 twelve-month targets from 2003 to 2014, found the average target sat about 12% above the share price on the day it was set.
Asquith and his co-authors saw the same thing from another side: the more optimistic the target, measured by how far it sat from the current price, the less often it was reached. A target far above today's price is not a stronger read than a modest one. In their data it was a weaker one.
None of this makes analysts useless. It makes a single target a starting point for a question, and a consensus figure an average of starting points.
What an AI stock prediction is
An AI stock prediction is a number a model produces after training on historical data. The model looks for patterns in prices, volume, company figures or news that came before moves in the past, then scores today's data against them. What comes out depends on the vendor: a single price, a range, a direction, or a probability of doing better than an index.
The shape matters. Danelfin's forecast pages, checked on 31 October 2026, show a price range for horizons from one month to one year at a stated 68% confidence level, and set it beside the analysts' single 12-month target. A 68% band says, in plain terms, that roughly one time in three the price is expected to land outside it.
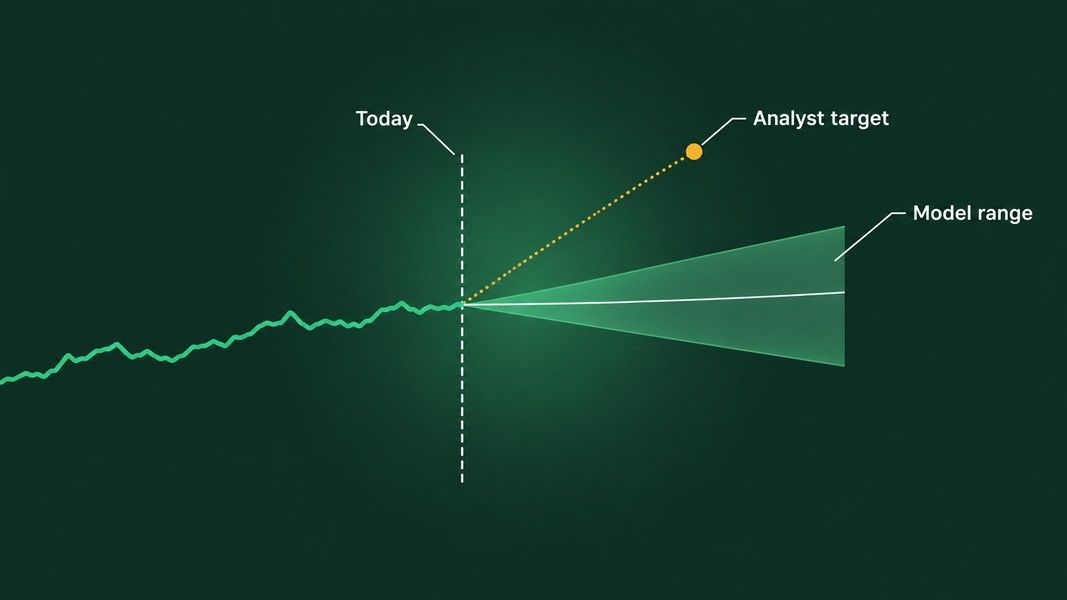
A single point hides that uncertainty, whether a person or a model produced it. A range at least shows you how wide the model thinks the future is.
What the research says about AI stock prediction
The most cited test is a 2020 study by Shihao Gu, Bryan Kelly and Dacheng Xiu in The Review of Financial Studies. They ran linear models, regression trees and neural networks on almost 30,000 US stocks from 1957 to 2016, holding back the 30 years from 1987 to 2016 purely for testing. Neural networks did best. Their monthly out-of-sample R² for single stocks peaked at 0.40%.
That number needs a plain translation. R² is the share of the variation in stocks' monthly moves that the model explains. At 0.40%, more than 99% of what a single stock did in a month was left unexplained. The authors still describe it as a real step forward, and in finance it is: the paper notes that a plain forecast of zero beats the historical average of past moves, so the bar starts on the floor.
The best published machine learning work explains a sliver of single-stock moves, and that sliver is useful spread over thousands of stocks, not as a call on one.
The signals every method leaned on most were price trends, meaning momentum and short-term reversal, followed by liquidity, volatility and valuation ratios. In other words, the models found mostly what chart readers and value investors already watch, weighed in combinations a person could not track by hand.
What language models added
Language models were tested too. Alejandro Lopez-Lira and Yuehua Tang gave GPT-4 news headlines published after its training cutoff, from October 2021 to May 2024, and asked whether each was good, bad or neutral for the company's stock. In the published version in the Journal of Financial Economics, the model called the direction of the market's first reaction on about 90% of portfolio days.
The catch is in the authors' own wording. That first reaction happens before an ordinary reader could act on it, so they call it non-tradable. The model's scores also pointed to a slower drift afterwards, strongest in small stocks and on bad news, and that edge shrank as more investors adopted language models.
So the honest summary is narrower than the headlines about the paper. A language model reads the tone of news well. Reading tone is not the same as knowing where a price will be in a year.
Where AI predictions break
Three weaknesses come up again and again. A model knows only the years it was trained on, so a kind of market it never saw, a new rate regime or a shock to one industry, is outside its experience. A model can also fit noise: in the Gu, Kelly and Xiu tests, a linear model given all 920 features was beaten by a plain forecast of zero because it overfit its training data.
The third weakness belongs to chatbots. In its investor guidance on AI, FINRA warns that AI output can be faulty or even made up when the input data was right, and tells investors to be cautious about using it to predict changes in a security's price. A confident paragraph is not evidence. You can read more on where AI chart reading goes wrong, which covers the same limits for a chart photo.
The record in one table
Every figure below is a measured average from a past sample. It tells you how things went then, not what to expect from the next target or the next model.
| Study | Sample | Period | What it found |
|---|---|---|---|
| Asquith, Mikhail and Au | 818 targets from First Team analysts | 1997 to 1999 | 54% reached within 12 months; misses got to 84% of the target on average |
| Bradshaw, Brown and Huang | 12-month targets in I/B/E/S | 2000 to 2009 | 64% met at some point, 38% met at month 12, average absolute error 45% |
| Accounting and Business Research | 201,200 targets on UK-listed stocks | 2003 to 2014 | The average target sat about 12% above the price when set |
| Gu, Kelly and Xiu | Almost 30,000 US stocks | Tested 1987 to 2016 | Best monthly single-stock R² of 0.40% |
| Lopez-Lira and Tang | GPT-4 reading post-cutoff headlines | Oct 2021 to May 2024 | Called the first reaction's direction on about 90% of portfolio days; the later edge shrank |
Notice what the two halves of the table measure. The target studies grade a price against a date. The AI studies grade small statistical tilts across thousands of stocks. We found no published study that grades AI 12-month price predictions on single stocks the way Bradshaw, Brown and Huang graded analysts, so the figures on offer are a vendor's own, and they come from the seller.
Feature by feature
The table compares results. These four sections compare how the two are made, which tells you how much weight each number can carry.
What each one reads
An analyst reads the company. Filings, guidance, earnings calls, conversations with management, the competitors and the supply chain. That depth is the strength of a target, and it comes at the cost of speed and breadth: one analyst covers a short list of stocks and updates a target a few times a year.
A model reads whatever it is fed, for every stock at once. It catches price trends, volume and shifts in news tone the moment the data arrives. It cannot ask the chief financial officer why margins fell, and it cannot know about anything that never entered its data.
Can you see the reasoning
A full research report has to explain its valuation method and its risks. The problem is that most investors never see the report. They see the consensus number on a free quote page, which strips every reason away and leaves an average of conclusions.
AI tools vary. Some show which inputs drove the score, others show only the number. Inside a neural network the reasons are hard to unpack even for the people who built it, so what you can check is usually what the tool chooses to display beside the number.
How fresh each number is
A target is refreshed after earnings or big news and can sit unchanged for months in between. A consensus figure can mix a target set last week with one set before the last earnings report, and the average does not tell you which is which.
An AI prediction is usually recomputed daily or on request. That makes it fresher, and also jumpier: a number that moves with every week of price action is following the price as much as it is anticipating it.
Which way each one leans
Analyst targets lean high, as the studies above show, and a consensus inherits that lean. An AI model leans towards the market it learned from. If its training years were mostly rising markets, its sense of normal is a rising market, and nothing in the output tells you so. Neither lean is hidden from you once you know to look for it.
How to read the two when they disagree
Back to the stock at $118, with a consensus target of $140 and an AI prediction of $112. Before picking one, turn both into percentages: the target implies about 19% up, the prediction about 5% down. Then work through a few questions.
- Spread. A $140 consensus built from targets between $125 and $150 is a different thing from one built from targets between $90 and $210. Look for the high and low, not just the average.
- Dates. Check when the targets were last changed. A target set before the latest earnings report may describe a company that no longer exists in quite that form.
- Inputs. Ask what the AI read. A model that leans on momentum will mark down a stock after a slide, whatever the fundamentals say.
- Lean. Remember the 15% gap between implied and actual moves in the analyst study, and remember that the model has no published 12-month record at all.
- Reasons. Find the one or two facts each number rests on, then judge those facts yourself.
When the two disagree, the gap is a question to research, not an answer to pick. Most of the time the disagreement points at a single issue, an earnings estimate, a margin trend or a recent drop, and that issue is what deserves your hour of reading.
Where Primo Trade's Forecast Value fits
Primo Trade, the app behind this blog, is one of the AI tools in this comparison, so here is exactly what it shows. A ticker analysis includes a Forecast Value: one price the model estimates for 6 to 12 months out, with the upside or downside against today's price. It can be missing, and an analysis from a chart photo never has one.
Primo Trade gives AI-generated analysis for information and education. It is not financial advice. Markets carry risk; do your own research before you trade.
Read the Forecast Value the way the research says to read any single point: as the model's estimate, not a place the price is headed. It sits beside the parts that show what the read rests on, the Primo Score across Risk, Sentiment, Technical, Fundamental and Growth, up to three Key Insights tagged by where they come from, and Recent News with dates. If the model's estimate and an analyst consensus disagree, those are the places to look for why.
Conclusion
An analyst price target and an AI stock prediction answer the same question with different tools. A target is a person's valuation, written under disclosure rules, leaning high, and in the larger of the two target studies met at the 12-month mark only 38% of the time. An AI prediction is a model's reading of past patterns, broad and fast, and the best published research explains well under 1% of a single stock's monthly moves.
Use both as prompts rather than answers. Look at the spread and the date behind a target, at the inputs and the shape behind a prediction, and at the reasons when the two disagree. The number a year out is the least informative part of either one; what it is built from is where the reading starts.