
RSI Indicator: Why Overbought Can Stay Overbought
The RSI indicator above 70 marks strong momentum, not a top. How the 14-day RSI works, why it stays overbought for weeks, and what divergence really says.
How to read stock charts, signals and market news, and where AI analysis helps.
The RSI indicator above 70 marks strong momentum, not a top. How the 14-day RSI works, why it stays overbought for weeks, and what divergence really says.

Price to book ratio through Intel in 2024: how the stock fell below book value, why the book then shrank, and what the ratio could not show.
TrendSpider review from its own plan pages: what every plan shares, what the cheaper plans cap, and which kind of chart reader it suits.

Engulfing candle, tested: bearish engulfing reversed 79% of the time, bullish 63%, yet both ranked low for what came next. Where each one fails.
A risk to reward ratio of 1 to 3 needs its target hit once in four trades. Why gapped stops, costs and distant targets push that number up.

An AI stock picker turns hundreds of indicators into one score. What it ranks, over which window, and why it says little about the one stock you hold.
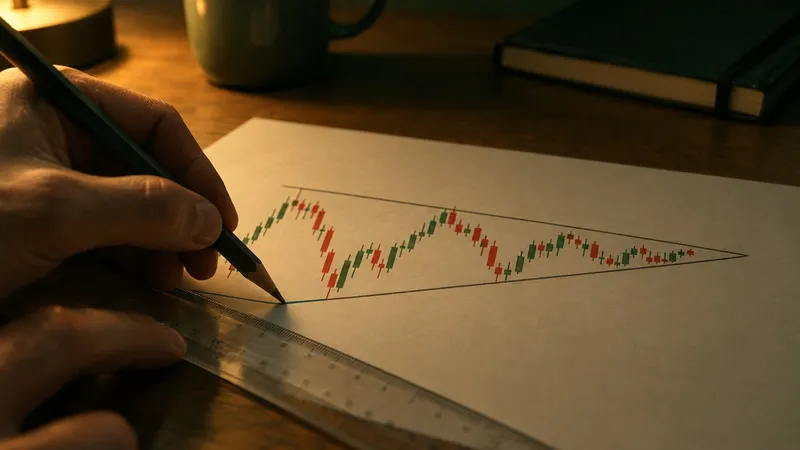
How to read a triangle pattern: ascending, descending and symmetrical, which way each broke in Bulkowski's data, and why the apex matters.

PE ratio myths that mislead investors: why under 15 is not automatically cheap, why Micron looked cheapest at its 2022 peak, and which PE you are reading.
Scalping trading means holding a stock for seconds or minutes to catch a few cents. See how the bid-ask spread decides whether that math can work.
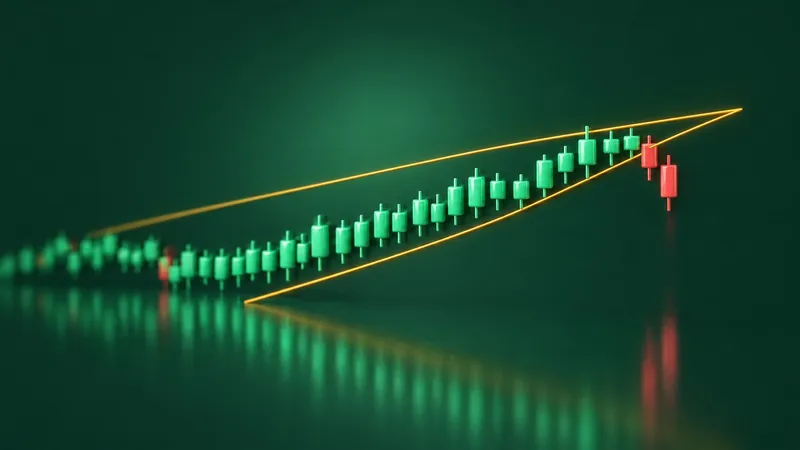
Rising wedge pattern vs falling wedge: each slopes one way and usually breaks the other. Shape, volume, confirmation and Bulkowski's failure rates.

Stock dilution, read through AMC's filings from December 2020 to August 2023: the share sales, their prices and what they did to a 100-share stake.
TradingView alternatives for US stock charts, read from each vendor's own plan pages: what the free tiers allow and where each tool fits better.