Seven tabs open. Seven AI stock analysis tools, and every one of them says its AI is the clever one. So which is best?
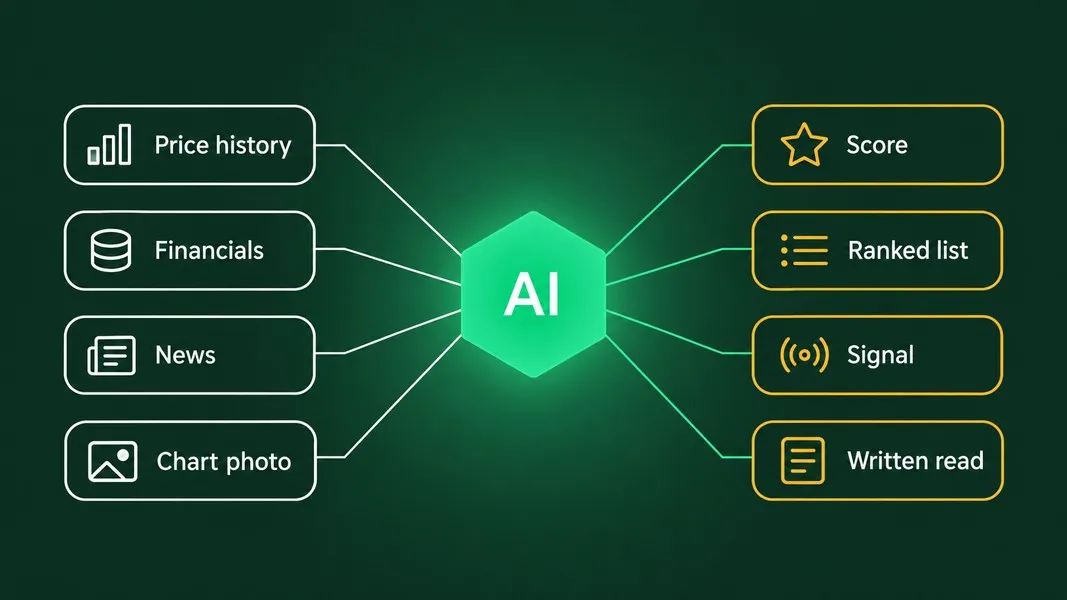
Wrong question, it turns out. These tools read completely different things, from hundreds of indicators across the whole market to a single photo of a chart. They hand back completely different things too, from a score of 1 to 10 to a paragraph in plain English. Pick by the question you bring and the choice gets easy.
Below is the verdict first, then what each tool reads, what it hands back and the catch in each. One of the seven, Primo Trade, is our own product. It gets the same treatment, gaps included.
The Best AI for Stock Analysis Depends on Your Question
Find your question in the left column. That is most of the decision.
| Your question | Start with | Because it |
|---|---|---|
| "Which of thousands of stocks should I even look at?" | Danelfin or Kavout | Ranks the whole market by a score |
| "Where is this chart pattern showing up?" | Tickeron or TrendSpider | Searches charts across many symbols |
| "What is moving in the next hour?" | Trade Ideas | Scans live during the session |
| "Can I get a signal feed on my phone?" | Prospero.ai | Is a phone app built around signals |
| "What is going on with this one stock or chart?" | Primo Trade | Reads one ticker or one chart photo and explains it |
| "Can I just ask anything, my way?" | A general chatbot | Takes any question, but you design it and check it |
Plenty of people use two of these: a ranker or scanner to find candidates, then a single-stock read to look closer before deciding for themselves.
AI Stock Analysis Tools at a Glance
Every detail below comes from each tool's own pages, checked from the United States on October 8, 2026, so treat it as dated to that day. Prices are left out; they change too often.
| Tool | What the AI reads | What you get back | Horizon | The catch |
|---|---|---|---|---|
| Danelfin | 900+ technical, fundamental and sentiment indicators | AI Score 1 to 10, four subscores | 3 months | Probabilities, not certainties, in its own words |
| Kavout | Fundamental, technical and sentiment data on 9,000+ US stocks | Kai Score, Stock Rank, Technical Rating, strategy lists | Not stated (rankings refresh daily) | The picker sits behind the Pro tier |
| TrendSpider | Your charts, market data, fundamentals, filings, news | Pattern recognition, an AI assistant, backtests, bots | Whatever you set | A lot of platform for one question |
| Tickeron | Price patterns and trends | Pattern matches with confidence levels, signals, robots | Intraday to swing | Confidence describes past setups |
| Trade Ideas | Live market data | Holly buy and sell signals, scans | Intraday | The homepage examples are a highlight reel |
| Prospero.ai | Institutional data and market movements | Key signals, cumulative scores | Short and long term | Its fine print says the results are simulated |
| Primo Trade | One ticker's prices, news and financials, or one chart photo | Signal, Primo Score, strategy idea, Key Insights | 6 to 12 months for the Forecast Value | One stock at a time, no scans or alerts |
Primo Trade gives AI-generated analysis for information and education. It is not financial advice. Markets carry risk; do your own research before you trade.
One Monday, Three Honest Answers
Before the tools, one dated example of why the horizon column matters more than any brand name.
Monday, January 27, 2025. Nvidia closed at $118.42, down from $142.62 the Friday before, a drop of about 17% in one session, according to Yahoo Finance's daily price history. Reuters tied the sell-off to a low-cost AI model from the Chinese startup DeepSeek and called it a record one-day loss in market value for a Wall Street stock.
Here is what followed, read long after the fact from the same Yahoo Finance data:
| Checkpoint after the January 27 close | Close | Versus January 27 |
|---|---|---|
| Next day, January 28, 2025 | $128.99 | +8.9% |
| Three months, April 28, 2025 | $108.73 | -8.2% |
| Six months, July 28, 2025 | $176.75 | +49.3% |
A same-day signal, a three-month score and a 6 to 12 month estimate were answering three different questions that Monday. Each could look wrong at one checkpoint and fine at the next. Nothing on the chart that day said which path came next, and no model could have known it either.
So the first thing to match is not the AI but the horizon. A tool built for the next hour and a tool built for the next quarter can both be honest and still disagree.
Danelfin: One Number per Stock
Danelfin boils each stock down to a single AI Score from 1 to 10. According to its own explanation, a higher score means a higher probability that the stock outperforms the market over the next three months. For US stocks and ETFs the benchmark is the S&P 500 total return index; for European stocks it is the STOXX Europe 600.
The inputs run long: 10,000 features per stock per day, built from more than 600 technical, 150 fundamental and 150 sentiment indicators. It covers US stocks, Europe's main markets and US-listed ETFs. Beside the headline score sit Fundamental, Technical, Sentiment and Low Risk subscores, and an explanation window shows which features pushed the score up (green) or down (red).
That window is the good bit. You can see that a high score leans on momentum rather than earnings, and decide whether you believe the reason. Danelfin also publishes how each score level has done historically, with the universe, date range and sample size printed beside the chart: more homework than most tools show.
The catch: Danelfin says it plainly. Its AI "calculates probabilities, not certainties," and the scores are "useful but not infallible information." Some stock pages also show an AI forecast for set time frames, so check which horizon a number means. It runs on the web and in free-to-download iOS and Android apps with paid plans inside.
Best for: sorting a big universe of stocks by one comparable number, with the reasons on show.
Kavout: Rankings by Strategy
Kavout's AI Stock Picker ranks more than 9,000 US stocks every day with three measures: the Kai Score, Stock Rank and a Technical Rating. Kavout says they combine fundamental, technical and sentiment data, and the rankings refresh daily.
What you browse is a menu of strategies rather than one score: Greenblatt Magic Formula, Lynch Growth Momentum, Dual Analysis and more, each with its own top list for large caps, small caps, the S&P 500 and so on. Around the picker sit tools named InvestGPT, Financial Agents, Smart Signals and Market Movers.
The catch: a top-ten list tells you which stocks a model prefers under its rules today. It does not tell you why one of them suits you, so the research on each name starts after the list. The picker itself sits behind the Pro tier, and Kavout's disclaimer says nothing on the site "constitutes investment, financial, trading, or any other form of advice."
If you like screening by a named strategy and want a ranked shortlist to dig into, this is your tool.
TrendSpider: The Whole Cockpit
TrendSpider is the multi-tool of the group. It is a full charting and research platform with automated pattern recognition, scanners, a no-code strategy tester that runs over decades of market data, and an ML Quant Lab that trains a machine learning model on inputs you choose.
The newest layer is Sidekick, its AI assistant. TrendSpider says Sidekick can see your charts, pull market data, read SEC filings, insider transactions, news and earnings call transcripts, and work as an agent: building scanners, creating alerts across a watch list and researching several symbols from one prompt. You choose which large language model answers, from Google, Anthropic or OpenAI, and even a personality, from long-term investor to number-crunching quant.
The catch: breadth. TrendSpider rewards people who already chart every day and know what they want to test. For one quick read on one stock, it is a lot of cockpit. Its no-code bots can also place trades for you, a bigger commitment than reading a chart. Its own footer says nothing in the platform "should be construed as investment advice of any kind."
Best for: active traders who want charting, scanning, backtesting and an AI assistant under one roof.
Tickeron: Pattern Hunting at Scale
Tickeron builds its AI around chart shapes. Its AI Pattern Search Engine finds end-of-day chart patterns with breakout and target prices, confidence levels and how the pattern behaved in the past. AI Real Time Patterns does the same during the session, and the AI Trend Prediction Engine gives, in Tickeron's words, "AI's opinion on whether a stock may go up or down."
If you would rather not run the tools yourself, there are Daily Buy/Sell Signals aimed at swing traders, delivered end of day, and AI robots that generate several trade ideas a day, which its robots page sorts into 5, 15 and 60 minute timeframes. Several of the tools offer a free try, and there are apps for iOS and Android.
If you already spot bullish and bearish chart patterns by eye, Tickeron is a way to hunt for them across many stocks at once.
The catch: a "confidence level" on a pattern describes how similar setups behaved before, not what this one will do. Same shape, new market.
Best for: traders who think in patterns and want a machine to do the hunting.
Trade Ideas: Built for the Next Hour
Trade Ideas is the most caffeinated tool on this list. Its AI, called Holly, produces buy and sell signals with entry and exit points during the session. Around it sit Money Machine for momentum setups, TI Wave for market pattern recognition, a scanner, backtesting and simulated trading on live data. Orders can go straight to the market through its TradeStation link.
There is a free account to explore the scans and a free weekly email of AI setups. The AI signals themselves are part of the paid plans.
The catch: on October 8, 2026 its homepage led with four recent Holly buy signals and the big moves that followed each one. That is a highlight reel, not a track record. A list of the best calls says nothing about the calls that did not work.
Best for: day traders who want live scans and signals and already have a plan for acting on them.
Prospero.ai: Signals in Your Pocket
Prospero.ai is a phone-first app on iOS and Android, and it markets itself as free. Its homepage says it combines millions of data points into key signals, drawing on institutional data and market movements.
In the app, cumulative scores show which stocks are gaining strength or losing steam, and an in-app guide explains how to read the signals.
The catch: the headline is confident; the fine print is careful. The homepage invites you to "identify short-term and long-term winners" and publishes performance figures for its newsletters. Its own disclaimer, on the same page, says those results relate to signals from its models, "are not actual trading results," and that simulated results "do not represent actual trading." Read that part first, here and on any tool's page.
It suits investors who want a signal feed on their phone and treat it as one input among several.
What About Just Asking a Chatbot?
Fair question. You can paste a chart screenshot into a general assistant such as ChatGPT and ask what it sees; OpenAI says image inputs work on both free and paid plans.
What it reads is the picture plus your question. What comes back is whatever shape you ask for, which is both the appeal and the problem: you are designing the analysis as you go, and nothing fixes which data it checks or how it scores anything.
OpenAI's own image inputs FAQ is frank about the weak spots. It says the model may struggle with graphs where colors or line styles vary, struggles with tasks that need precise positions, and "may generate incorrect descriptions." A candlestick chart is mostly colors, line styles and positions.
Primo Trade: One Stock or One Chart at a Time
Our own app, so weigh this section accordingly. It reads one thing at a time, through one of two doors.
Search a US-listed stock or ADR ticker, from about 16,000 symbols, and the AI reads its prices, recent news and financial metrics. Or photograph or screenshot any chart, and the AI reads the chart itself: trend, volatility, volume, sentiment and the pattern it sees, which our chart patterns cheat sheet lets you look up. If it spots a US ticker on the image, the full ticker analysis runs instead.
Every result carries a Signal from Strong Buy to Strong Sell as the AI's directional read, a Primo Score radar of five scores from 0 to 100, a Trading Strategy idea with a risk level, and up to three Key Insights. Ticker analyses add a price chart, Recent News and a Forecast Value, the model's 6 to 12 month estimate. A chart photo has no ticker data behind it, so it gets none of those three. The way AI reads a chart has real limits, and they apply here.
Its gaps, as plainly as the others':
- No market-wide scan or ranking; you bring the stock.
- No alerts, watchlist, portfolio, backtests, bots or order placement.
- No real-time data, and only US-listed stocks and ADRs.
- Mobile only, on iOS and Android.
- A crop with no axis or timeframe limits what the AI can read.
It is free to download, with free analyses to start, and it fits best as a second read on one stock or chart you already have open.
Red Flags Regulators Have Named
"AI" makes a handy sticker, and regulators have noticed. In March 2024 the SEC announced settled charges against two investment advisers, Delphia and Global Predictions, for false and misleading statements about their use of AI. The agency called the practice "AI washing," and the firms agreed to pay civil penalties of $225,000 and $175,000.
FINRA, the SEC and NASAA also published a joint alert on AI and fraud. It warns about platforms claiming their AI "can't lose," and cautions that AI-generated information might rest on data that is inaccurate, incomplete or out of date. Even when the input is correct, it says, AI output "can be faulty, or even completely made up."
None of the tools in this guide make "can't lose" claims, and several carry careful disclaimers. The alert is still a good filter for anything new you find. If a tool sells certainty, the problem is the tool, not your skepticism.
Five Checks for Any AI Stock Analysis App
Once you know which kind of tool fits, these five questions sort a useful one from a confusing one:
- Can you see why? A score with no visible reasons is hard to act on. Danelfin's explanation window is one example of a tool showing its work.
- Which horizon does it mean? A three-month probability, a 6 to 12 month estimate and an intraday signal answer different questions, as the Nvidia Monday shows.
- What does it cover? US only, US and Europe, ETFs or not. Check before you search for a stock it never rates.
- How are past results framed? Backtests, simulated results and homepage highlight reels are not a record of real trades. The better tools say so on the same page.
- Does it fit your week? A platform you open once a month will not repay the hours a full charting suite asks for.
Free AI Stock Analysis: What You Can Try First
Almost everything here lets you look before you pay, though what is free differs a lot.
Prospero.ai presents its app as free. Danelfin is free to download with paid plans inside, and Primo Trade is free to download, with free analyses to start. Tickeron offers free tries of several tools, Trade Ideas has a free account and a free weekly email of AI setups, and TrendSpider includes a small monthly allowance of free Sidekick messages. Kavout keeps the AI Stock Picker in its Pro tier.
A free tier is a fair way to judge one thing: whether the output makes sense to you. Run it on a stock you already know well. If the AI's read matches what you understand about the company, or points out something you missed and shows why, that is a good sign. If it gives a firm signal with no visible reason, the free trial has already told you what you needed to know.
The Bottom Line
AI stock analysis tools are not one product. Rankers score the whole market, scanners hunt for setups, signal apps push a feed, chatbots answer whatever you ask, and single-stock readers explain one name or one chart. Each reads different data and answers a different question.
Compare them on four things: what the AI reads, what it hands back, the horizon it means and how honestly it describes its own limits. Treat every score, signal and backtest as one input to your own research, and be wary of any tool that promises more than that.