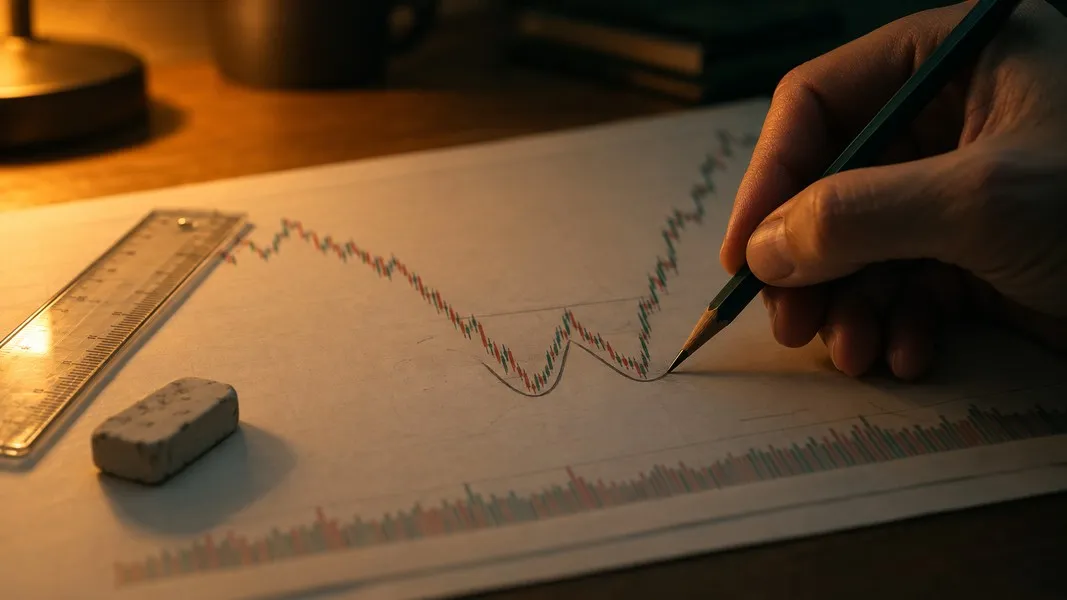
A stock slides for months, bounces, slides back to the same low and bounces again. It looks like a W, and the second low feels like the moment. Then price drops straight through it.
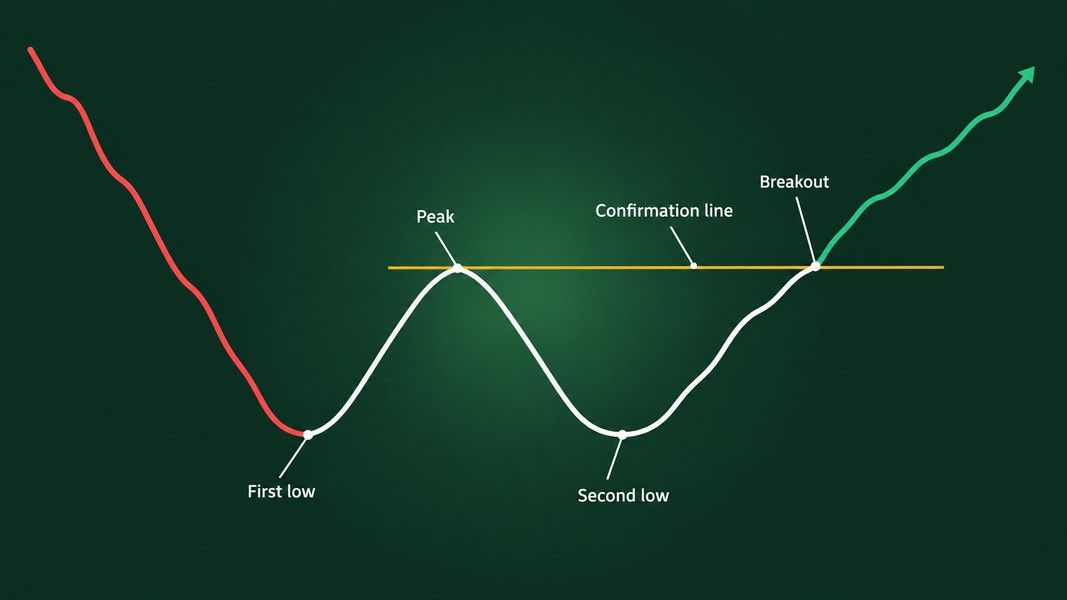
A double bottom pattern is two lows at roughly the same price after a downtrend, with a peak between them. It only becomes a double bottom when price closes above that peak. Before that close, it is two dips on a chart, and Thomas Bulkowski, who has measured these patterns across thousands of trades, puts the chance that price keeps falling without ever confirming at 48%.
This post walks the pattern the way you would watch it form, one stage at a time, with what each stage needs and what cancels it. The numbers come from Bulkowski's samples and StockCharts' ChartSchool, and the worked example is a real stock from 1999 and 2000.
Stage 1: there has to be a downtrend to reverse
A double bottom is a reversal pattern, so it needs something to reverse. StockCharts' ChartSchool guide asks for a significant downtrend of several months before the first low. Fidelity's chart pattern course makes the same point more bluntly: price has to trend down into the pattern, or it is not a double bottom.
This rule filters out a lot of false Ws. Two equal lows inside a sideways range are just the floor of the range. Two equal lows after a short dip in a rising stock can still work, but they are a pause in an uptrend, not the end of a downtrend.
The size of the decline matters too. Bulkowski's rule of thumb is that price must have something to reverse, so if the decline leading into the double bottom is small, expect a small rise. A tall left side, a steep fall with few pauses along the way, is what he calls a Big W.
Stage 2: the first low and the peak
The first low is unremarkable when it prints. It is simply the lowest point of the trend so far, and nothing about it says "bottom". ChartSchool describes it as fairly normal, with the downtrend still firmly in place.
What follows is the advance that builds the middle peak. ChartSchool puts it at 10 to 20% off the first low. Bulkowski asks for at least 10% between the bottoms and admits he often ignores that guideline. A bounce of 3% is not a peak; it is noise.
That peak is the most important price on the chart. It becomes the confirmation line, the level the whole pattern hangs on. Mark it now, before the second low tempts you to see something that is not there yet.
Stage 3: judging the second low
The second low is where the pattern either takes shape or does not. Three things decide it.
Price. The two lows should sit near the same level. ChartSchool counts a second trough within 3% of the first as valid. Bulkowski's Eve and Eve sample allows 0 to 6% between the bottoms, and his Eve and Adam sample 0 to 4%.
Time. ChartSchool says the gap between the lows can run from a few weeks to many months, with one to three months the norm and at least four weeks preferred. In Bulkowski's Eve and Eve sample, most twin valleys fall 2 to 7 weeks apart. Two lows three days apart are a wobble, not a double bottom.
Shape. Bulkowski splits double bottoms into four kinds by how each low looks. A narrow, spiky V is an Adam bottom; a wide, rounded one is an Eve bottom. That gives Adam and Adam, Adam and Eve, Eve and Adam, and Eve and Eve, which is the shape most chartists call the classic double bottom.
Telling them apart is easier than it sounds. Bulkowski's advice is to ask whether the two bottoms look similar or different, then check whether each one stays slender or widens out as it rises. In his bull market figures, Eve and Eve ranks 5th of 39 chart patterns, Adam and Eve 17th and Adam and Adam 26th.
Stage 4: wait for the close above the peak
This is the stage people skip. The second low holds, price starts to climb, and it feels like the pattern is done. It is not. ChartSchool is explicit that many potential double bottoms form during a downtrend, and none of them is confirmed until resistance breaks.
The rule is the same everywhere: the double bottom confirms when price closes above the peak between the two lows. Bulkowski is blunter than most about the alternative. Without confirmation, he writes, you do not have a double bottom, "just squiggles on a chart."
The 48% figure is the reason to wait. Across his double bottom samples, Bulkowski found that buying before confirmation meant a 48% chance price continued lower instead of confirming. That is close to a coin toss on a shape that looks finished.
A close matters more than a touch. A stock can poke above the peak during the session and fall back by the bell, and that is a failed test, not a breakout. Fidelity's course notes that until price breaks out, the range can carry on and turn into a triple pattern instead.
Stage 5: read the volume
Volume does more work in a double bottom than in most patterns. ChartSchool says volume is more important for the double bottom than for the double top, and it wants to see buying pressure accelerating on the advance off the second low.
The usual sequence looks like this:
- Higher volume on the left bottom than on the right, which Bulkowski finds is usual.
- Low volume on the decline into the second low, as ChartSchool describes it.
- Rising volume on the climb from the second low, ideally with a gap or a fast advance.
- Increased volume, or an accelerated climb, on the break above the peak.
Bulkowski adds one finding that runs against intuition: a downward volume trend across the whole pattern suggests better performance after the breakout, not worse. Quiet trading while the base forms is not a warning sign by itself.
A break on thin volume does not cancel the pattern. It is a weaker read, because the buying pressure ChartSchool looks for is missing.
Stage 6: measure the target and expect the throwback
Once the pattern confirms, the classic measure rule gives a rough target. Take the height from the lowest low up to the peak, and add it to the breakout price. ChartSchool and Fidelity both describe it this way, which means a bigger pattern implies a bigger move.
Bulkowski uses a more cautious version. In his Eve and Eve sample of 952 trades, 65% of patterns reached the full measured target. So he multiplies the height by that percentage before adding it to the breakout price.
Then plan for the throwback. A throwback is price returning to the confirmation line after the breakout, and it is common: Bulkowski measured a throwback rate of 65% for Eve and Eve and 67% for Adam and Eve. ChartSchool calls this resistance turned support, and notes that the first pullback often tests it.
A throwback is normal; a close below the bottom of the pattern is not. Bulkowski calls that a busted double bottom. The upward breakout has failed, and the pattern no longer means what it meant a week ago.
Keep the statistics in proportion. His break even failure rate for Eve and Eve is 12%, and his average post-breakout move looks enormous. Bulkowski says himself that these figures come from perfect trades measured to the ultimate high, and that the chance of duplicating them consistently is probably zero. They are a measured past average from his sample, not something a reader can expect.
A worked example: Pfizer, 1999 to 2000
ChartSchool's own example is Pfizer (PFE), read after the fact. It shows every stage above, and the dates make it easy to follow.
| Stage | What happened | Price |
|---|---|---|
| Downtrend | Fell from a high in April 1999 to a new 52-week low in December 1999 | About $50 to $30 |
| First low and peak | Rose more than 20% off the low into a reaction high | About $37.50 |
| Second low | Fell back to the same low, a little over two months after the first | $30 |
| Volume | Five of the six up days after the second low traded well above the 60-day exponential average of volume | |
| Confirmation | Broke above the peak with a gap up on the open and another volume expansion | Above $37.50 |
Run the measure rule on those numbers. The height is $37.50 minus $30, or $7.50, so the classic target is $37.50 plus $7.50, which is $45. Using the 65% from Bulkowski's Eve and Eve sample, the target is roughly $42.40.
Now the honest part. At the second low, nobody knew it would hold. Between the two lows, Pfizer also made a second attempt at the $37.50 level after a short pullback, and it failed. Someone reading the chart before the break saw a stock that had been turned back at resistance and was sliding toward $30 again, and only the break above the peak turned the setup into a double bottom.
The double top: the same stages upside down
A double top is the mirror image: two highs at roughly the same price after an uptrend, with a trough between them. Fidelity's course is strict about the entry: price has to trend up into a double top, and someone who spots one in a falling stock has found something else.
Every stage flips. The pattern confirms when price closes below the trough between the two peaks, the measure rule subtracts the height from the breakdown price, and the return to the broken level is called a pullback rather than a throwback.
Two differences are worth knowing. ChartSchool notes that bottoms usually take longer to form than tops, so a double bottom often needs more patience. It also says volume matters more on the bottom than on the top, so thin volume is less of a concern on a double top.
If you want the double bottom next to the head and shoulders, the flag and the cup and handle, our chart patterns cheat sheet lays them out side by side. The same neckline logic, at a larger scale, drives the head and shoulders pattern.
The double bottom pattern process at a glance
| Stage | What to look for | What cancels it |
|---|---|---|
| 1. Prior trend | A decline of several months into the first low | No real downtrend, or a sideways range |
| 2. First low and peak | A bounce of roughly 10 to 20% off the low | A bounce of a few percent |
| 3. Second low | Within about 3 to 6% of the first, weeks apart | Lows days apart, or a clear new low |
| 4. Confirmation | A close above the peak between the lows | An intraday poke that closes back below |
| 5. Volume | Rising on the climb and on the break | Nothing alone; thin volume weakens the read |
| 6. After the break | A throwback to the confirmation line | A close below the bottom of the pattern |
Getting a second read on a double bottom
Spotting the shape is the easy part; being honest about which stage it has reached is the hard part. This is where a second read helps.
Primo Trade reads a photo or screenshot of a chart and gives the AI's view of the trend, volatility, volume and sentiment it sees, the chart pattern it recognises, and what that pattern usually signals. The result also carries a signal, a Primo Score and a Trading Strategy idea with a risk level. If it reads a US ticker on the image, the full ticker analysis runs, with recent news and the model's 6 to 12 month estimate.
Primo Trade gives AI-generated analysis for information and education. It is not financial advice. Markets carry risk; do your own research before you trade.
What the AI cannot do is see a close that has not happened. A chart photo taken at the second low shows a possible double bottom, and the confirmation stage still belongs to the market.
The short version
A double bottom pattern is a process, not a shape. It needs a downtrend, a first low, a peak of roughly 10 to 20%, and a second low near the first one, weeks later. It becomes a double bottom only on a close above the peak, and Bulkowski's 48% figure for price falling further without confirmation is the reason to wait for that close.
After the break, the measure rule gives a rough target, and a throwback to the confirmation line is the usual next step. A close below the bottom of the pattern busts it. Volume and the size of the prior decline shade the read, and the double top runs through the same stages upside down.