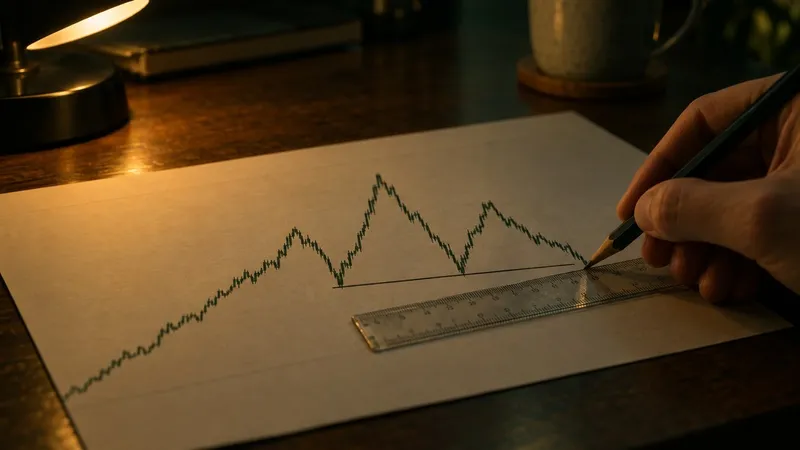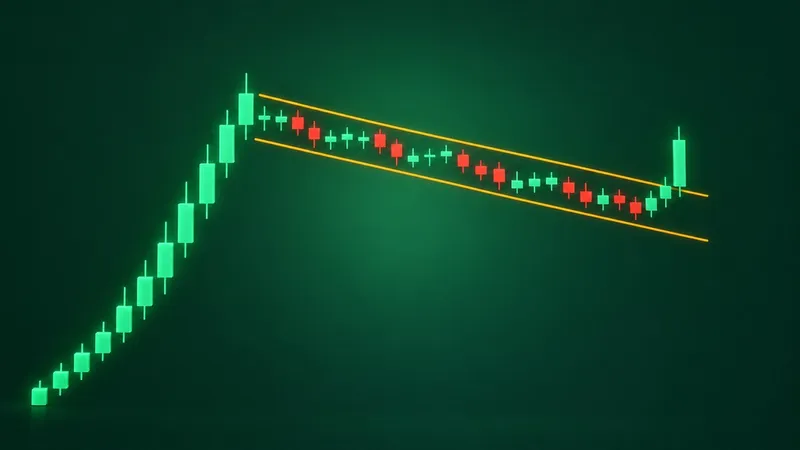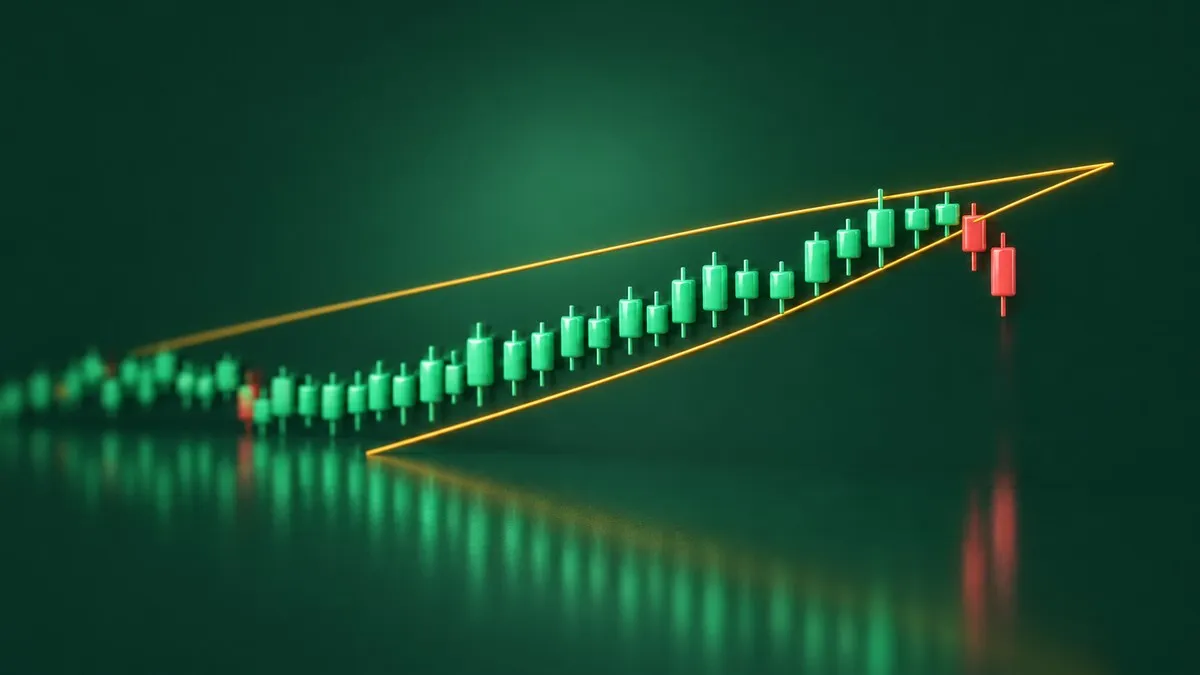
A stock climbs for two months. Every high is a little higher than the last, every dip stops a little higher too, and yet each rally feels shorter than the one before it. Draw a line across the highs and another across the lows, and the two lines lean upward and squeeze toward each other. Someone calls it a rising wedge and says it is bearish. The chart is going up. How can that be bearish?
That is the whole puzzle of the rising wedge pattern and its mirror image. The quick verdict: a rising wedge slopes up and usually breaks down, and a falling wedge slopes down and usually breaks up. The slope tells you which way the price has been drifting. The narrowing tells you that drift is running out of push.
"Usually" is doing real work in that sentence. This comparison covers how each wedge forms, how the two differ part by part, what Thomas Bulkowski's statistics say about how often each break follows through, and the lookalikes that get mislabelled as wedges.
Rising wedge pattern vs falling wedge at a glance
| Rising wedge | Falling wedge | |
|---|---|---|
| Both lines slope | Up | Down |
| Bias in the textbooks | Bearish | Bullish |
| Breaks the usual way (Bulkowski) | Down, 60% of the time | Up, 68% of the time |
| Volume before the break | Fades 79% of the time | Fades 72% to 75% of the time |
| Confirms on | A close below the lower line | A close above the upper line |
| Usual break failed to move 5% | 51% | 26% |
The last row is where the two patterns stop being mirror images. In Bulkowski's bull market sample, about half of the rising wedges that broke down never fell even 5% before turning. Falling wedges that broke up failed that test about a quarter of the time. The shapes are symmetrical. The record behind them is not.
What a rising wedge pattern is
A rising wedge pattern is a narrowing price range between two upward-sloping trendlines that converge toward a point. The lower line connects higher lows. The upper line connects higher highs, but it climbs more slowly, so the range gets tighter as the price rises.
StockCharts' ChartSchool calls the rising wedge a bearish pattern whether it forms as a reversal at the end of an advance or as a pause inside a downtrend. Its reasoning is about momentum. The advances from each low get shorter and shorter, which makes the rallies unconvincing, even while the series of higher highs and higher lows keeps the trend technically pointed up.
ChartSchool asks for at least two reaction highs and two reaction lows, ideally three, and says the pattern usually forms over three to six months. It also says bearish confirmation does not come until the lower support line breaks in a convincing fashion, and that waiting for a break of the previous reaction low can be the more careful choice.
A rising wedge on the Ann Taylor chart
ChartSchool's worked example is Ann Taylor (ANN). From a low of around $10 in October 1998, the stock passed $23 in under seven months, with a final leg from below $15 in February to $23.50 in mid-April. Its upper line formed on three higher peaks and its lower line on three higher lows, with the lower line visibly steeper.
The stock hugged the support line for over a week before breaking with a sharp decline. A few days later it broke the previous reaction low on a long black candle with expanding volume. The April low near $20, once support, turned into resistance, and the stock tested it in early July before falling further.
What a falling wedge is
A falling wedge is the same structure tilted the other way: two downward-sloping trendlines that converge. The upper line connects lower highs and falls steeply. The lower line connects lower lows but falls more gently, because each new low only just undercuts the one before it.
On its falling wedge page, ChartSchool calls the pattern bullish whether it is a reversal or a continuation, with one condition attached: the bullish bias is only realised once the price breaks above the upper resistance line. Shallower new lows suggest selling pressure is easing. They do not show buyers taking over until that break happens.
For the reversal version, ChartSchool wants an extended downtrend first, at least three months old, with the wedge itself usually forming over three to six months. As with the rising wedge, it suggests waiting for a break above the previous reaction high as extra confirmation.
A falling wedge on the Freeport-McMoRan chart
ChartSchool's textbook example is Freeport-McMoRan (FCX). Its downtrend began in the third quarter of 1997, paused briefly in March 1998, and resumed, with the stock at new lows by February 1999. The wedge's upper line formed on four lower peaks and its lower line on four lower lows, each only slightly below the last.
In late February 1999 the low flattened out and the stock sat just above $9 for a few weeks. The breakout came in March with a series of strong advances, above-average volume on up days, and a brief pullback to the old trendline before the stock moved higher again.
How the two wedges differ, part by part
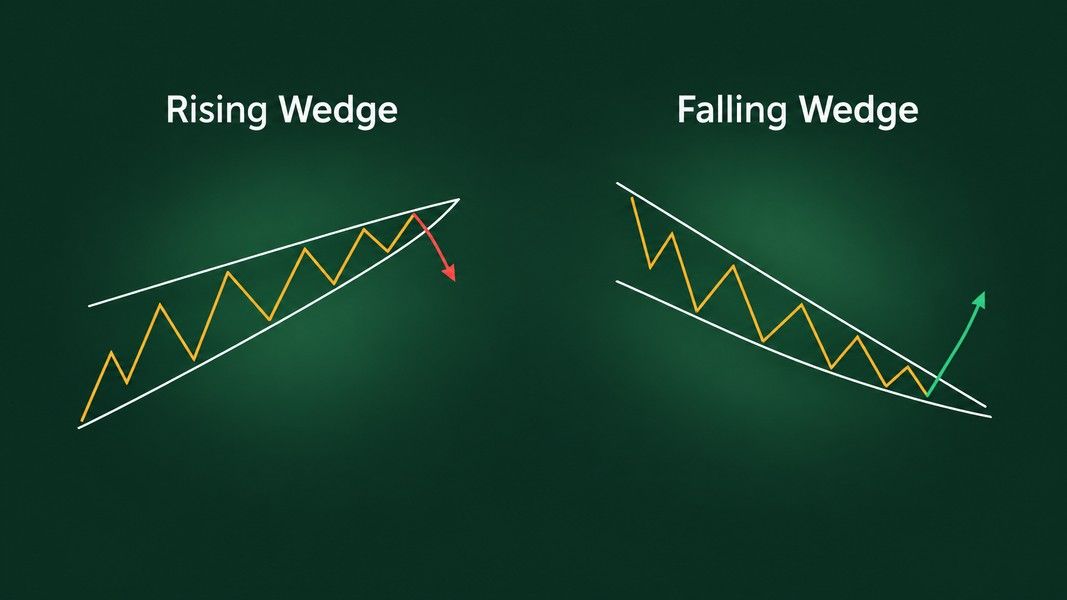
Side by side, the two wedges look like mirror images. The useful differences sit in four places: how the lines converge, what volume does, how the break confirms, and what is supposed to happen after it.
The slope and the squeeze
In both wedges, both lines point the same way. That is what separates a wedge from a symmetrical triangle, where one line rises and the other falls. The tell is which line is steeper. In a rising wedge, the lower line climbs faster than the upper one, so buyers keep stepping in higher while each push to a new high gets weaker. In a falling wedge, the upper line drops faster than the lower one, so each sell-off reaches a new low with less force than the last.
Bulkowski adds a counting rule on his rising wedge statistics page that he repeats for the falling wedge: the price should touch the trendlines at least five times, three on one line and two on the other, to outline a good pattern. Fewer touches and you are often looking at two lines drawn through noise.
Volume while the wedge forms
Volume tends to fade in both. Bulkowski measured it trending downward until the breakout in 79% of rising wedges and in 72% to 75% of falling wedges.
The two patterns part ways at the break. ChartSchool treats an expansion of volume on the support break as bearish confirmation for a rising wedge, but says volume is not particularly important there. For a falling wedge it says the opposite: volume expansion is an essential ingredient, and a falling wedge breakout without rising volume lacks conviction and is vulnerable to failure. Bulkowski's data leans the same way. He found falling wedges with heavy breakout day volume performed better.
The break and the confirmation
Both sources agree that the pattern is only a pattern once the price closes outside a trendline. Bulkowski's rule is to wait for a close outside one of the lines before acting on it. ChartSchool goes a step further and suggests waiting for the previous reaction low or high to break as well.
Timing differs a little. Bulkowski found the average upward breakout from a rising wedge came 67% of the way to the apex, the point where the two lines would meet. Falling wedge breakouts came 61% to 62% of the way there.
What happens after the break
Here the two sources disagree, and the disagreement is worth knowing. ChartSchool says there is no measuring technique for the decline after a rising wedge, and other analysis should be used to estimate how far the price may go. Bulkowski gives a measure rule: for a downward break from a rising wedge, the lowest valley inside the pattern is the target, and for an upward break from a falling wedge, the highest peak is.
Even with that rule, his numbers show how often the target was not reached. Only 32% of rising wedges that broke down reached the measure-rule target. Falling wedges that broke up reached theirs 62% of the time, and the rarer upward breaks from rising wedges 63%.
What Bulkowski's numbers say about wedges
Thomas Bulkowski publishes pattern statistics on his site, and his wedge figures were last updated in August 2020. The rising wedge figures rest on more than 1,400 trades and the falling wedge figures on over 800, all from bull markets. Every number below is a measured frequency from that past sample, not a result anyone can expect from the next wedge.
| Bull market results | Rising wedge, up / down break | Falling wedge, up / down break |
|---|---|---|
| Break direction | Down 60% of the time | Up 68% of the time |
| Failed to move 5% | 19% / 51% | 26% / 29% |
| Average move after the break | 38% / 9% | 38% / 14% |
| Came back to the breakout price | 72% / 72% | 62% / 74% |
| Performance rank | 32 of 39 / 36 of 36 | 31 of 39 / 27 of 36 |
Bulkowski defines a failure here as a pattern that does not rise or fall at least 5% after the break, which he describes as failing to cover the cost of trading. The average move runs from the open the day after the breakout to the ultimate high or low. "Came back" means the price traded back at the breakout level within 30 days, which he calls a throwback after an upward break and a pullback after a downward one.
The rising wedge's textbook break is its weakest
This is the part a slope-based rule of thumb leaves out. The break everyone expects from a rising wedge, the downward one, ranked 36th out of 36 patterns with downward breakouts in Bulkowski's list. Last place. Half of those breaks failed to fall 5%, and the average decline was 9%.
The rarer upward break, which happens about 40% of the time, ranked 32nd of 39 and failed only 19% of the time in the same sample. Bulkowski's summary is blunt: rising wedges, especially with downward breakouts, are some of the worst performing chart patterns, with high failure rates and small declines after the break.
So "rising wedge means bearish" is true about direction more often than not. It says much less about distance.
The falling wedge fares better, but not by much
The falling wedge's usual break, upward, failed 26% of the time and ranked 31st of 39. Better than its mirror, but Bulkowski still calls it a poor performer among bullish chart patterns, with a high failure rate and a low average rise.
On his falling wedge statistics page he lists a few traits linked to better results in his sample: an upward gap on the breakout day, a taller pattern, and heavy breakout volume. He also describes a move he calls a dip, where the price breaks down out of a falling wedge, curls around the front of it, and then rises. A downward break from a falling wedge is not always the end of the story.
Wedge vs triangle, pennant and channel
Most wedge mistakes are labelling mistakes. Four shapes get confused with wedges, and each one is read differently.
- Symmetrical triangle. One line slopes up and the other down. ChartSchool notes a symmetrical triangle has no definitive slope and no bullish or bearish bias, while a wedge leans one way and carries one.
- Ascending or descending triangle. One line is flat. A flat top with rising lows is an ascending triangle, not a rising wedge, even though both narrow upward.
- Pennant. Same converging shape, but short. Bulkowski sets three weeks as the minimum for a wedge; anything shorter is a pennant, which belongs with flags after a sharp move.
- Channel. Two lines with the same slope that do not converge. A rising channel is a steady trend inside a steady range, and calling it a rising wedge pins a bearish bias on a shape that does not carry one.
The pennant overlap matters most on short charts. If the narrowing shape follows a near-vertical move and lasts days rather than weeks, our comparison of bull flags and bear flags covers that family. For the wider set of shapes, sorted by what they usually signal and what they do not, the guide to bullish and bearish chart patterns is the place to start.
Reading a wedge before it breaks
A wedge in progress is a question, not an answer. A few checks separate a real one from two lines drawn to fit a story.
Count the touches first. Five or more, split three and two between the lines, is Bulkowski's bar. Then check the length: under three weeks, call it a pennant. Look at which line is steeper, because that is what makes the squeeze meaningful. A rising wedge whose upper line is steeper than its lower one is not a wedge at all. The lines spread apart, which Bulkowski files under a different pattern, the ascending broadening wedge.
Then watch volume. Fading volume inside the wedge is normal for both patterns. On a falling wedge, the break is the moment volume matters most, by ChartSchool's account and in Bulkowski's data.
Finally, wait for the close. An intraday poke through a trendline that closes back inside the wedge is not a breakout. Both sources want a close outside the line, and ChartSchool suggests waiting for the prior reaction low or high to go too. Waiting gives up some of the move when a break holds, and that is the price of not acting on a poke that reverses straight back.
A wedge does not know the news
Old examples make the point. In a May 1997 magazine article, Bulkowski showed Cognex breaking down out of a rising wedge after disappointing earnings, with volume of 1,602,000 shares on the breakout day against 10,000 shares two days before. The wedge set the stage. The earnings news is what moved it, and no line on a chart could have told you that news in advance.
Reading a wedge from a chart photo
Wedges are hard to spot by eye, and harder to judge once you have stared at a chart long enough to want a particular answer. A second read helps most at that point, before the break, when the pattern is still only a possibility.
Primo Trade reads a photo or screenshot of a chart and gives the AI's view of the trend, volatility, volume and sentiment it sees, the chart pattern it recognises, and what that pattern usually signals. The result also carries a signal, a Primo Score and a Trading Strategy idea with a risk level. If it reads a US ticker on the image, the full ticker analysis runs, with recent news and the model's 6 to 12 month estimate. Treat a wedge label from the AI the same way you would treat one from a person: as a reading to check against the touches, the length and the close.
Primo Trade gives AI-generated analysis for information and education. It is not financial advice. Markets carry risk; do your own research before you trade.
To keep the shapes straight while you look, the chart patterns cheat sheet puts the wedges beside the triangles, flags and reversal patterns they get confused with.
The short version
A rising wedge slopes up between two converging lines and usually breaks down. A falling wedge slopes down and usually breaks up. In both, the lines lean the same way, one line is steeper than the other, and volume tends to fade until the break.
The direction is the easy part. In Bulkowski's bull market sample, the rising wedge broke down 60% of the time, but half of those breaks failed to fall even 5%, the lowest performance rank of any downward breakout pattern on his list. The falling wedge broke up 68% of the time and failed less often, yet still ranks near the bottom of bullish patterns.
So read a wedge as a narrowing range with a lean, not as a forecast. Count the touches, check that it lasted at least three weeks, watch volume at the break, especially on a falling wedge, and wait for a close outside the line. Even then, a confirmed wedge is a description of what the price has done, and the next move still has to happen on its own.