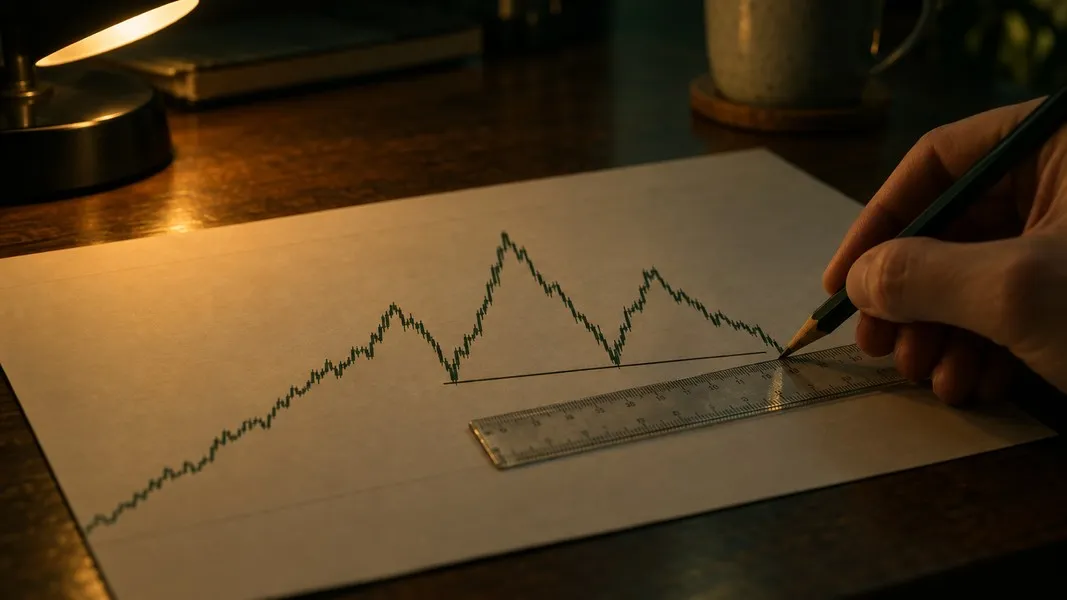
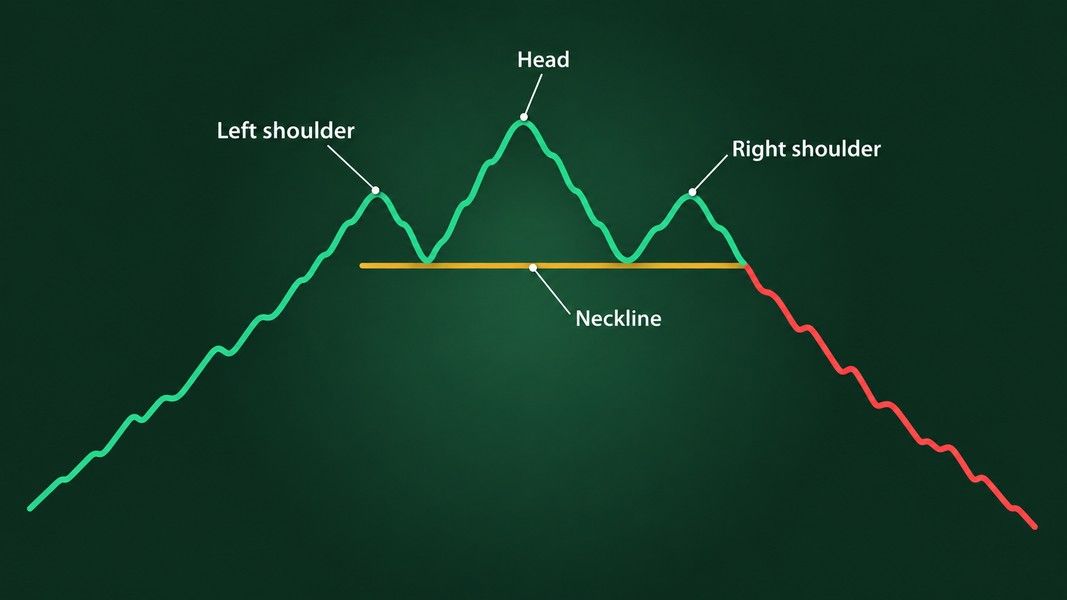
Three peaks, the middle one tallest, the two outer ones roughly level. You have seen the diagram in every trading book, and now it is sitting right there on your screen. The neckline has not broken yet, but it looks so clean that waiting feels like a waste of time.
That moment is where the head and shoulders pattern catches most people. The shape is easy to spot and hard to finish. This guide covers what the pattern is, top and bottom, which line actually confirms it, and the numbers on how often it never completes, how often the price comes back to the line after the break, and what a busted one looks like.
What the head and shoulders pattern is
A head and shoulders top is a reversal shape that forms after a rise. The price makes a peak (the left shoulder), a higher peak (the head), then a lower peak (the right shoulder). A line through the two dips between those peaks is the neckline.
The pattern is read as a rise running out of buyers. Each push up gets sold, the last push fails to reach the head, and a close below the neckline says the uptrend has turned. Flip the whole thing upside down and you get the inverse head and shoulders, three troughs with the deepest in the middle, read as a fall running out of sellers.
So is the head and shoulders pattern bullish or bearish? The top is bearish, the inverse is bullish, and neither is anything until the price closes through the neckline. Our guide to bullish and bearish chart patterns puts the shape beside its relatives and walks through one real head and shoulders that changed its mind.
The parts: shoulders, head and neckline
Thomas Bulkowski, who has catalogued chart patterns for decades, sets out his head and shoulders top identification guidelines in plain terms. There has to be an upward trend leading into the pattern, because a reversal needs something to reverse. The middle peak sits above the other two, and the whole thing should look proportional, not lopsided.
Symmetry is the part people skip. The two shoulders should peak near the same price, sit roughly the same distance from the head, and look alike, both wide or both narrow. A right shoulder that towers over the left, or sits three times further from the head, is a different shape wearing a famous name.
Volume tells part of the story too. Bulkowski finds it is usually highest on the left shoulder, followed by the head, and that it trends downward through the pattern 61% of the time. Fewer shares changing hands on each new push up is what a rally losing interest looks like.
Where the neckline really breaks
The neckline joins the two armpits, the lows between the shoulders and the head. It is rarely flat. When it slopes up, Bulkowski counts the pattern as confirmed on a close below that line. When it slopes down, chasing the line lower can leave you waiting forever, so he uses a close below the right armpit, the low between the head and the right shoulder, instead.
That small rule matters more than it looks. The confirmation point is a specific close, not the moment the right shoulder starts to sag. Until that close, you are looking at three bumps.
The inverse head and shoulders pattern
The inverse head and shoulders pattern forms after a fall. The price drops to a low (the left shoulder), drops further to a deeper low (the head), then bounces and pulls back to a higher low (the right shoulder). The neckline runs across the two highs between them, and a close above it completes the shape.
The mirror image is close, but not exact. StockCharts' ChartSchool says volume is the main difference: an increase in volume on the neckline break is welcome for a top, and for a head and shoulders bottom it is absolutely required. Their description wants heavy selling into the left shoulder, rising volume on the advance off the head, light volume as the right shoulder pulls back, and a clear expansion on the break.
Bulkowski's bottom guidelines add two details from his data. A short drop of up to three months leading into the pattern produced the best results afterwards, and a left shoulder that bottoms higher than the right one was followed by weaker moves. The slope of the neckline flips too: for a bottom, he confirms on a close above a down-sloping neckline, or above the right armpit when the neckline slopes up.
Tops versus bottoms in numbers
Here is how the two versions compare on Bulkowski's own pages, using his bull-market results. His break-even failure rate is the share of patterns where the price failed to move at least 5% in the expected direction after the breakout.
| Bulkowski, bull markets | Head and shoulders top | Inverse head and shoulders |
|---|---|---|
| Break-even failure rate | 19% | 11% |
| Reached the measured target | 51% | 71% |
| Came back to the neckline after the break | 68% (pullback) | 65% (throwback) |
| Volume trended down inside the pattern | 61% | 65% |
Read the table as a description of his past samples on his own rules, with the top page dating its statistics to August 2020. His bull markets exclude the 2000 to 2002 and 2007 to 2009 bear markets, his results are measured from perfect trades, and none of it is peer reviewed. It is a record of what happened in his data, not a forecast for the chart in front of you.
Even so, the gap between the columns is worth noticing. Bottoms failed less often and reached their targets more often. Bulkowski explains the same gap in his confirmation data simply: prices have tended to rise over time, so a bullish shape has the long-run drift on its side and a bearish one has it against it.
The shape that never confirms
Most guides start counting once the neckline breaks. The trouble is that you see the shape first, and the break may never come.
Bulkowski tested exactly that. On his page about confirmed patterns, he ran automated pattern recognition over stocks since 2000 and counted how often a shape that had formed then failed to confirm. In bull markets, 38% of head and shoulders tops and 24% of head and shoulders bottoms never closed through their line. In bear markets the figures were 33% and 31%.
| Pattern, bull markets | Failed to confirm |
|---|---|
| Double tops | 63% |
| Triple tops | 65% |
| Head and shoulders tops | 38% |
| Double bottoms | 44% |
| Triple bottoms | 43% |
| Head and shoulders bottoms | 24% |
Next to double and triple tops, head and shoulders looks good. Bulkowski is careful about why. Either the pattern is more reliable, he writes, or his software had a harder time finding valid ones, since it found 1,176 head and shoulders bottoms in bull markets against 3,039 double bottoms. A smaller, cleaner sample can flatter any number.
The practical reading: more than a third of the tops in that sample would have been a mistake to act on before the close below the neckline. His trading tips on both pattern pages open the same way: wait for confirmation.
Head and shoulders pattern trading after the break
Say the neckline breaks. The next thing that usually happens is that the price comes back to it.
After a downward break, that retest is a pullback; after an upward break, it is a throwback. By Bulkowski's convention it happens within 30 days of the breakout. His throwback study found that 58% of 10,305 chart patterns with upward breakouts since 2000 had one, and 70% of those with breakouts on above-average volume did. After the price came back to the breakout level, 35% kept falling below the pattern.
StockCharts reads the same event as broken resistance turning into support, and notes that the price often comes back to the neckline after a bottom breaks out. Bulkowski adds the less comfortable half: on both the top and the bottom pages, he finds that a pullback or throwback hurts what comes after. A break that holds clear of the line has tended to do better than one that sinks back to it.
That gives you three moments to watch after the break, and each one tells you something different:
- The retest. Expect the price to come back to the neckline at some point. It happened to most patterns in his data.
- The hold. A neckline that holds on the retest is the pattern still telling its story.
- The bust. A close back through the far side of the pattern means the story has stopped being true.
When a head and shoulders pattern fails: the busted break
A failed head and shoulders pattern has a precise meaning in Bulkowski's work. For a bottom, he calls it busted when the price breaks out upward, rises no more than 10%, then drops and closes below the bottom of the pattern, below the head.
His page on busted bottoms shows a Stillwater Mining chart doing exactly that: a clean upward break, a short rise, then a slide below the head. For single busted bottoms, the average decline afterwards was 22%, again measured from perfect trades.
Here is the useful part. A busted pattern is not just a disappointment, it is information. The shape said buyers were taking over, the price said otherwise, and the close below the head is the clearest exit line the chart offers. Our guide to what a stop-loss is covers how stop orders behave at a line like that, including the ugly case where a stock gaps straight through one overnight.
The measure rule, and why targets stay rough
Most guides add a price target. The classic version takes the distance from the head to the neckline and projects it from the breakout: down for a top, up for a bottom.
Bulkowski trims that. He multiplies the height by his "percentage meeting price target", 51% for tops and 71% for bottoms, before projecting it, which builds in how often the full height was actually reached. StockCharts says plainly that any target should serve as a rough guide, and that old resistance levels, retracements and long moving averages will often matter more as the move unfolds.
His other trading tips are about context rather than geometry. A small rise into a top leads to a small decline, because the price needs something to reverse. A fast, steep rise into the pattern was often followed by a larger decline. And on his throwback page, overhead resistance from old peaks is the chief cause of a price falling back after an upward break.
If you want the head and shoulders next to the double top, the flag and the cup and handle, our chart patterns cheat sheet draws them side by side with what confirms each one.
Reading a head and shoulders chart pattern from a photo
The hard part is not knowing the rules. It is the right shoulder, while it is still being drawn. Is that bounce a shoulder, or the start of a new high? Is the neckline flat enough to count? A second read helps most at exactly that point.
Primo Trade reads a photo or screenshot of a chart and gives the AI's view of the trend, volatility, volume and sentiment it sees, the chart pattern it recognises, and what that pattern usually signals. The result also carries a signal, a Primo Score and a Trading Strategy idea with a risk level. If it reads a US ticker on the image, the full ticker analysis runs, with recent news and the model's 6 to 12 month estimate.
Primo Trade gives AI-generated analysis for information and education. It is not financial advice. Markets carry risk; do your own research before you trade.
Treat that read the way you would treat Bulkowski's tables: as a description of what is on the chart right now. An AI can name three peaks and a neckline; whether the close below it ever comes is something the chart has not decided yet.
The short version
A head and shoulders top is three peaks with the highest in the middle, read as bearish once the price closes below the neckline. The inverse head and shoulders pattern is three troughs with the deepest in the middle, read as bullish once the price closes above it, and it needs rising volume on the break far more than the top does.
The numbers are what make the shape useful. In Bulkowski's bull-market data, 38% of tops and 24% of bottoms never confirmed, most confirmed patterns came back to the neckline after the break, and full-height targets were reached by about half of tops and seven in ten bottoms. Wait for the close through the line, expect the retest, and treat a close back through the head as the pattern telling you it was wrong.