You have drawn two lines on a chart, they are closing in on each other, and price is bouncing between them like a ball in a narrowing hallway. That is a triangle pattern: price squeezed between two converging trendlines until it closes outside one of them. The shape comes in three versions, and each has a textbook direction. The measured record says the direction is the weakest thing the shape tells you.
This guide walks through reading a triangle in the order you would on a real chart: drawing the lines, naming the type, checking volume and the trend that came in, and knowing where in the triangle the break usually lands. The numbers come from Thomas Bulkowski's pattern statistics, so every figure is a past average from his sample of US stocks, not a promise about the next one.
What a Triangle Pattern Looks Like
Every triangle has two boundaries that meet at a point to the right, called the apex. What changes between the three types is which line slopes.
An ascending triangle has a flat top and rising lows. A descending triangle has a flat bottom and falling highs. A symmetrical triangle has both: lower highs pressing down and higher lows pressing up, so neither side owns the shape.
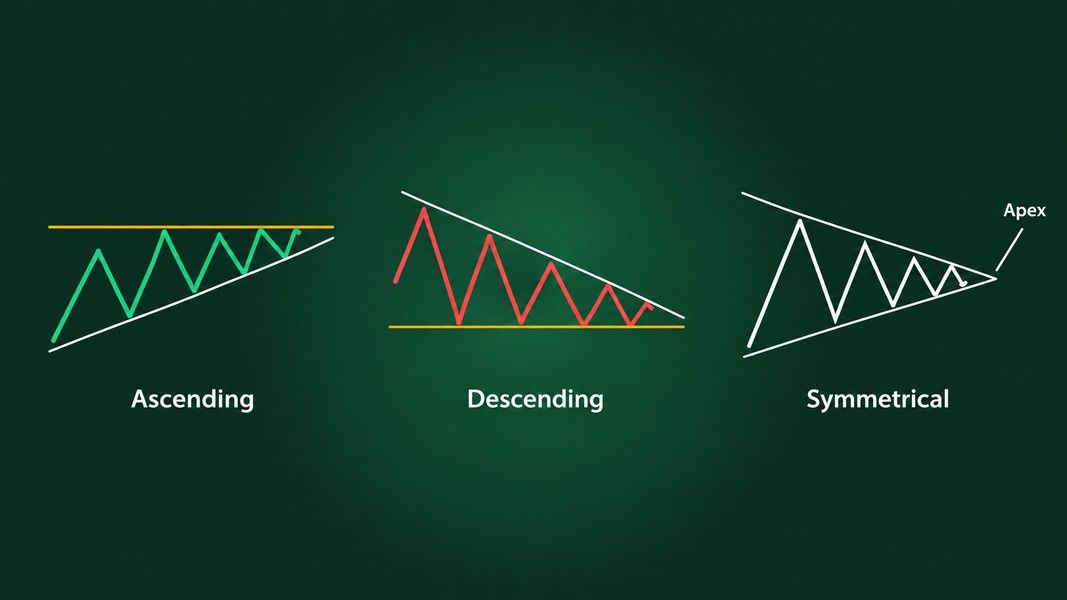
A triangle is a pause where buyers and sellers keep agreeing on a narrower range. The flat line marks a price one side keeps defending. The sloping line shows the other side giving up a little more ground on every swing.
What You'll Need Before You Start
You need less than you might think, but each item matters:
- A chart that shows the trend leading into the pattern, at least a few months on a daily chart, because the run-up or run-down is part of the read.
- Volume bars under the price, since the volume trend is one of the few clues the shape gives before it breaks.
- A rule for what counts as a break. Bulkowski uses a close outside the trendline, not an intraday poke through it.
A daily chart is the usual frame for the statistics below. StockCharts notes that triangles appear on many timeframes, down to one-minute and hourly charts for short-term trading, but Bulkowski's figures come from daily charts, so a five-minute triangle borrows them at its own risk.
Step 1: Draw the Two Lines Through Real Turns
Connect distinct peaks for the upper line and distinct valleys for the lower one. A peak is a swing high with lower prices on both sides, not a candle that happened to stick out.
Bulkowski's guideline for all three types is the same: price should touch one trendline at least three times and the other at least twice. Two touches on each line can be a coincidence. Five touches in total, with clear swings between them, is a pattern.
If you find yourself redrawing a line to catch one more wick, stop. A line you have to bend is a line the market did not draw.
Step 2: Check That Price Fills the Shape
This is the step most people skip. Bulkowski is blunt about it in his notes on descending triangles: price must cross the pattern from trendline to trendline, nearly filling the available space, and triangles with "abundant white space" should be avoided.
A real triangle looks busy inside. Price swings from one boundary to the other and back. A shape where price hugs one line and leaves the middle empty is just two lines you drew near some candles.
Step 3: Name the Triangle by Its Slopes
Once the lines are in, the type is a matter of which one is flat. The table below puts the textbook bias next to what Bulkowski measured in his bull-market sample of daily charts.
| Triangle | Lines | Textbook bias | Upward breakouts in the data | Break-even failure, up / down |
|---|---|---|---|---|
| Ascending | Flat top, rising lows | Bullish | 63% | 17% / 38% |
| Descending | Flat bottom, falling highs | Bearish | 53% | 22% / 23% |
| Symmetrical | Both lines converging | Neutral | 60% | 25% / 37% |
A break-even failure, in Bulkowski's glossary, is a breakout where price fails to move at least 5% in the breakout direction. He describes it as the share of patterns that fail to cover the cost of trading.
Ascending triangle pattern
The flat top acts like a large sell order sitting at one price. StockCharts describes the rising lows under it as the source of the bullish bias: buyers keep stepping in a little higher each time. In Bulkowski's figures for the ascending triangle, based on more than 1,400 patterns, the break went up 63% of the time.
Descending triangle pattern
Here the textbook and the data part ways. StockCharts ChartSchool calls the descending triangle a bearish pattern that indicates distribution. Bulkowski's descending triangle statistics, from more than 1,300 patterns, show upward breaks 53% of the time. That is close to a coin toss, and slightly in the direction the textbook does not expect.
Symmetrical triangle pattern
The symmetrical triangle is the neutral one, and in Bulkowski's symmetrical triangle results, from over 3,000 patterns, it broke upward 60% of the time. He also ranks it near the bottom of his list on overall performance, 36th of 39 for upward breaks and 34th of 36 for downward ones, and opens his page with the line that performance is "awful."
Step 4: Look at the Trend That Came In
The trend leading into a triangle can say more about the break than the triangle's own shape. Bulkowski found that when price rises into a descending triangle, the breakout is upward 63% of the time, well above the 53% for the pattern as a whole.
That is why the chart you start with needs months of history. A screenshot cropped tight around the triangle hides a clue that moved the odds noticeably in his data. StockCharts makes the same point in its overview of triangles: if the stock was in an uptrend before the triangle, there is a good chance it breaks out on the upside and continues.
Look at the three to six months before the first touch. Was price climbing into the pattern, falling into it, or drifting sideways? Write it down before you form a view on the break.
Step 5: Watch Volume Shrink
Volume usually dries up as a triangle forms. Bulkowski measured it trending downward in at least 78% of ascending triangles and 84% to 86% of symmetrical ones. StockCharts describes the same signature and adds that an expansion of volume on the break is preferred as confirmation, though not always present.
What you are looking for is a slow fade in volume while the range tightens, then a clear jump on the day price closes outside a line. For symmetrical triangles, Bulkowski's notes say patterns with breakout volume above the 30-day average did better after the break.
A break on thin volume is not automatically false. It is just one less reason to believe it.
Step 6: Mark How Far You Are Toward the Apex
Measure the triangle's width from its first touch to the apex, where the lines meet, and note where price is now. Breakouts tend to arrive late but not at the very end.
In Bulkowski's data, the break came about 64% of the way to the apex in ascending triangles, 61% to 65% in descending ones and 74% in symmetrical ones. A triangle that has squeezed all the way to the point without breaking has lost most of its shape; price is just drifting in a narrow band.
The apex itself has a habit worth knowing. In his apex study, covering 221 triangles across 388 stocks from late 2006 to early 2008, price made a minor high or low within a few days of the apex 75% of the time. In a second test of 239 triangles, price changed direction near the apex 60% of the time. Mark the apex date on your chart, because something tends to happen around it even after the breakout.
Step 7: Wait for a Close Outside the Line
A wick through the trendline is not a breakout. Bulkowski confirms a triangle only when price closes outside one of the boundaries, and the same rule protects you from the intraday spikes that pierce a line and snap back before the bell.
Then expect a retest. A throwback, after an upward break, is price coming back to the breakout level within 30 days; a pullback is the same after a downward break. In his ascending triangle data, throwbacks happened 64% of the time, and the other two triangles sit around 60% as well. Bulkowski also notes that throwbacks and pullbacks hurt performance after the break, so a retest is common, but it is not a good sign.
Step 8: Measure the Height, Then Shrink It
The classic target is simple. Take the widest part of the triangle, at its start, and add it to the breakout price for an upward break or subtract it for a downward one. StockCharts uses this full-height version.
Bulkowski adds a correction. He multiplies the height by the share of past patterns that actually reached the full target. For upward breaks that share was 70% in ascending triangles, 64% in descending ones and 58% in symmetrical ones. As a worked example with round numbers, an ascending triangle with a flat top at 50 and its lowest valley at 45 has a height of 5. The full-height target would be 55. Scaled by 70%, it is 53.50.
Either number is an estimate. Bulkowski's own glossary says the measure rule varies from pattern to pattern and is usually off, which is about as honest as a pattern statistic gets.
Tips for Better Results
Read triangles in pairs with the levels around them. A triangle that breaks upward straight into an old peak has resistance waiting overhead, and two of Bulkowski's trading lessons on symmetrical triangles show breaks that stalled under exactly that kind of overhead resistance. Our guide to support and resistance covers how to find those levels.
Give more weight to triangles that appear early in a trend. Bulkowski notes that descending triangles far up a rising trend tend to flame out quicker, and that symmetrical triangles do best after the break when they appear at the start of a trend.
Get a second read on the drawing itself. If you photograph or screenshot a chart, Primo Trade's Analyze Chart reads it and shows the chart pattern the AI sees, what that pattern usually signals, and its read of trend, volume and sentiment. That makes it a second opinion on whether the shape you drew is the shape the AI reads. It can only read what is in the picture, so keep the trend that came in inside the frame.
Primo Trade gives AI-generated analysis for information and education. It is not financial advice. Markets carry risk; do your own research before you trade.
Keep the chart patterns cheat sheet open while you practise, so you can compare the shape on your screen with the clean version of each pattern.
Troubleshooting Common Triangle Pattern Problems
Most triangle mistakes fall into a few repeat cases:
- Both lines slope the same way. That is not a triangle. Two lines rising together and converging form a rising wedge; two falling lines form a falling wedge, and they behave differently, as the guide to rising and falling wedges explains.
- The break reverses within days. That may be a busted pattern: Bulkowski defines a bust as a move of no more than 10% before price reverses and breaks out the other side. Almost half (46%) of ascending triangles with downward breaks busted and moved higher in his data.
- Price broke, came back inside, then broke the same way again. Symmetrical triangles have a tendency to double bust, where the final direction matches the original one.
- The triangle has only four touches. Wait. It may still become a triangle, or turn into a rectangle or something else.
When a break fails, the opposite line becomes the obvious reference. Bulkowski places a stop on the side opposite the breakout, for example below a minor low inside an ascending triangle after an upward break, unless that would be too far away to be practical.
What the Triangle Tells You and What It Does Not
A triangle pattern is good at one thing: showing that a range is tightening and that a break is getting close. The flat line tells you which price one side is defending, the volume fade tells you the market is waiting, and the apex tells you roughly when the waiting tends to end.
It is weak at the thing most people want from it, the direction. Ascending triangles broke up 63% of the time in Bulkowski's sample, symmetrical ones 60%, and descending triangles, the "bearish" one, broke up 53% of the time. In the descending triangle, the trend that came in moved those odds further than the shape did.
So read it in order: real touches, a filled shape, the incoming trend, shrinking volume, distance to the apex, then a close outside the line. Treat the target as a scaled estimate, expect a retest, and keep the opposite boundary in view in case the break turns around.