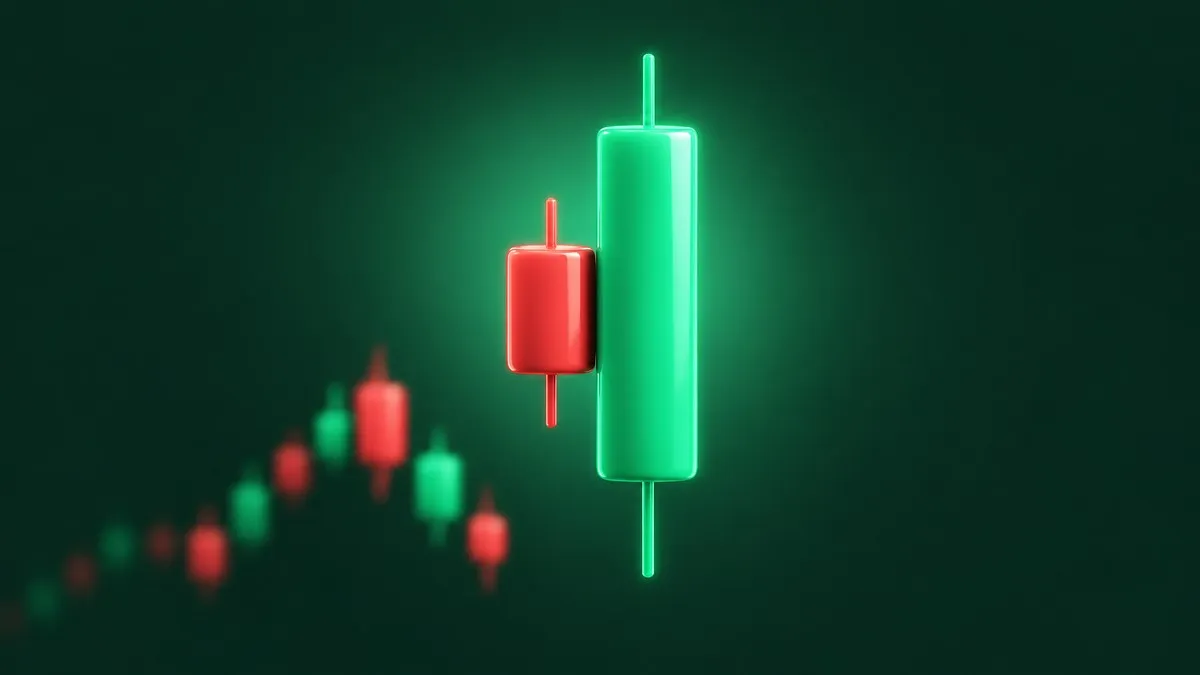
A stock has slid for a week. Then one session opens below yesterday's close, buyers take over, and by the bell a tall green candle has swallowed the small red one before it. Someone in the chat posts the screenshot with one word: engulfing.
An engulfing candle is a two-candle pattern in which the second candle's body completely covers the first candle's body and closes in the opposite direction. After a decline, a green body covering a red one is a bullish engulfing pattern. After a rise, a red body covering a green one is a bearish engulfing pattern. In Thomas Bulkowski's testing on US stocks, the bearish version reversed the trend 79% of the time and the bullish version 63%.
Those two numbers are where most write-ups stop, and they hide the more useful part. Both patterns ranked near the bottom of 103 candlesticks for how far price travelled after the break. This guide puts the two side by side, shows the lookalikes that fool people, and walks through where each one tends to fail.
Bullish vs Bearish Engulfing at a Glance
Here are the two patterns next to each other, with Bulkowski's measured figures. His ranks run from 1, the best, to 103.
| Bullish engulfing | Bearish engulfing | |
|---|---|---|
| Trend leading in | Down | Up |
| The two candles | Red, then a taller green | Green, then a taller red |
| Acted as a reversal | 63% of the time | 79% of the time |
| Rank for reversal rate | 22 | 5 |
| Rank for performance after the break | 84 | 91 |
| Rank for how often it appears | 12 | 11 |
Read the last three rows together. Both patterns turn price often and push it a short way. Bulkowski's pages on the bullish engulfing and the bearish one put it bluntly: the bearish engulfing "does not imply a lasting reversal", and the bullish version's post-breakout performance "can be dreadful".
The sample matters too. Bulkowski built his candlestick research on more than 4.7 million daily price bars from hundreds of US stocks, with data going back to the 1980s, and the bearish engulfing figure alone comes from roughly 20,000 patterns. These are averages from a past sample, not odds for the next chart you see.
What an Engulfing Candle Is, and What It Ignores
Three things make an engulfing candle, and all three get bent in practice.
The trend before it. A bullish engulfing needs a downtrend leading in, and a bearish engulfing needs an uptrend. The same two candles in the wrong trend are a different pattern with a different track record, which the failure section below covers.
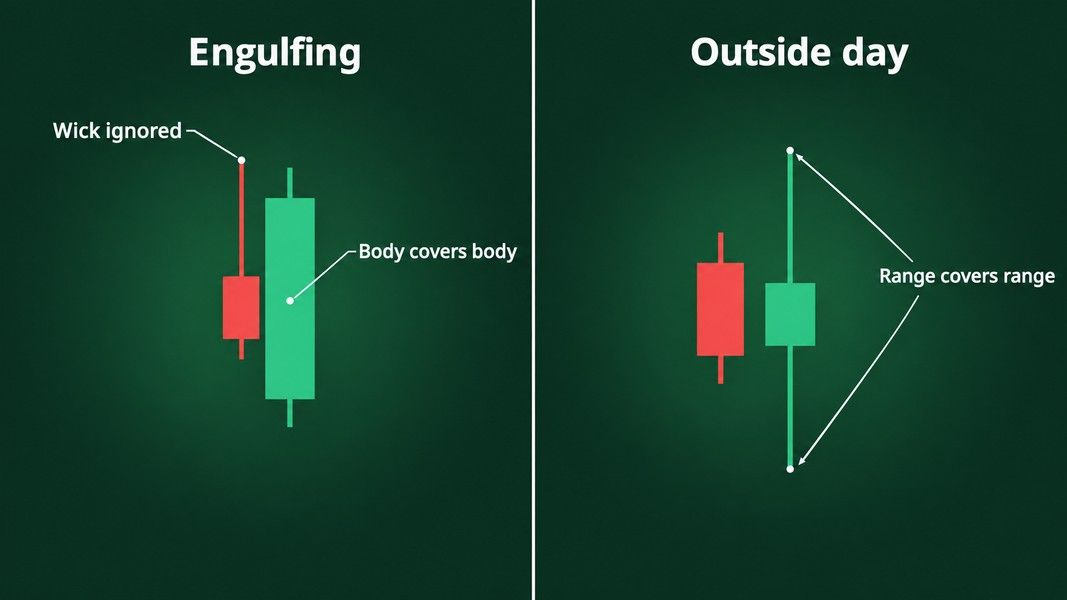
Bodies, not wicks. The second body has to cover the first body. The shadows do not count. Bulkowski's identification notes say "ignore the shadows", and his definition allows the tops or the bottoms of the two bodies to sit at the same price, but not both.
The open beyond the prior close. For a bullish engulfing, the green candle opens below the red candle's close and closes above the red candle's open. For a bearish engulfing, the red candle opens above the green close and closes below the green open. On a daily stock chart that means the second session opened beyond the first session's close before running the other way.
The guide to reading candlestick charts covers the four prices inside every candle, if the body and wick distinction is new.
Engulfing candle vs outside day
The pattern people most often mistake for an engulfing candle is the outside day, sometimes called an outside reversal. The StockCharts candlestick dictionary draws the line clearly: an outside reversal needs the whole range, high and low, to be covered, while an engulfing pattern needs only the open and close.
So the two overlap without being the same. A candle can engulf the prior body and still leave the prior wick poking out above or below it. Another can cover the whole prior range, wicks included, with a body that does not cover the prior body. When someone shares a chart and calls it engulfing, check the bodies first.
The Bullish Engulfing Candle: Turns Often, Travels Little
The bullish engulfing candle looks like the cleaner signal of the two. The bears push price lower on day one, day two opens lower still, and then buyers take the whole session back and more.
Bulkowski measured it as a bullish reversal 63% of the time, meaning price closed above the top of the two-candle pattern before it closed below the bottom. That ranks 22nd of 103 patterns. In the same body of work he called anything under 60% "random or nearly so", so the bullish engulfing clears his bar by three points.
The weak spot is what happens after the break. Its overall performance rank is 84 of 103. Bulkowski's notes say that even the best of its upward-breakout cases showed price 1.18% lower ten days later on average, where a working bullish pattern would normally show a rise. His conclusion is that the pattern did its best work in bear markets and after downward breakouts, which is the opposite of what the name promises.
Where the bullish engulfing did better
His trading notes for the pattern point to three conditions. Bullish engulfing candles that appeared within a third of the yearly low did better than the rest. Tall candles did better than short ones. And the ones to avoid were those that formed inside a downward primary trend.
That last point needs a picture. A bullish engulfing can show up in the middle of a long decline and lift price for a few days, and then the bigger downtrend takes over again. Bulkowski's own preference was a bullish engulfing in a pullback inside a rising primary trend, where the reversal lines up with the larger direction rather than fighting it.
The Bearish Engulfing Candle: Top Reversal Rate, Short Follow-Through
The bearish engulfing is the mirror image: in an uptrend, a green candle is followed by a taller red one that opens above the green close and finishes below the green open.
On reversal rate it is one of the strongest candles Bulkowski tested. On the bearish engulfing page he reports a bearish reversal 79% of the time, ranking 5th of 103, from about 20,000 patterns. His Stocks and Commodities article on the best-behaved candles gives the same 79% for bull markets.
Then comes the catch. For performance after the break it ranks 91st. The split by breakout direction explains why: after an upward breakout, the cases where the pattern failed, it ranked 103rd and 100th in bull and bear markets. After a downward breakout it ranked 25th and 21st. The bearish engulfing usually turns price, and when it does not, the move against it is among the worst of any candle.
Where the bearish engulfing did better
Bulkowski's notes for the bearish version are less intuitive. The ones that formed within a third of the yearly low did better than those near the high. In his article on when candles work best, a bearish engulfing in a bear market with a downward breakout averaged an 11.7% decline when it closed in the lowest third of the yearly range, against 9.4% for the middle third and 10.2% for the top third.
His other two notes match the bullish version: tall candles did better, and the setup he favoured was a bounce inside a falling primary trend. A bearish engulfing at the top of a short rally in a stock that is already in a downtrend lines up with the bigger move. One at the top of a strong uptrend is fighting it.
Where Each One Fails
The averages above hide the cases that go wrong. Most failures come from four situations, and they apply to both versions.
The right shape in the wrong trend
The same two candles mean something else when the trend leading in is reversed. Bulkowski tested these lookalikes as separate patterns:
- Last engulfing bottom: a green candle followed by a red one that engulfs it, in a downtrend. It is supposed to be a bullish reversal and acted as a bearish continuation 65% of the time.
- Last engulfing top: a red candle followed by a green one that engulfs it, in an uptrend. Supposed to be bearish, it acted as a bullish continuation 68% of the time.
- Bullish engulfing inside a long decline: the shape is right and the short-term trend is right, but the primary trend is down, and his example shows the bounce fading as the decline resumes.
The lesson is that colour and size alone do not define the pattern. A red candle swallowing a green one at a low is not a bearish engulfing, and it did not behave like one.
No confirmation from the next session
An engulfing pair completes at the close of day two, and Bulkowski measured reversal from the first close beyond the pattern. Some traders wait for that close, and the three-candle versions formalise it: three outside up is a bullish engulfing followed by a higher close, and three outside down is a bearish engulfing followed by a lower close. He measured them as reversals 75% and 69% of the time in bull markets.
He also tested three ways to confirm any candle pattern: the next close, the next candle's colour and an opening gap in the expected direction. The opening gap came first in 82% of cases, candle colour in 13% and the closing price in 5%. A gap in the expected direction at the next open was the earliest confirmation in most cases, and an open in the other direction is an early hint that the pattern may not hold.
Volume inside the pattern
A tall engulfing candle on heavy volume looks more convincing. Bulkowski's numbers say it barely matters. Above-average volume inside a candle pattern was linked to better performance 58% of the time, close to random. What did separate the results was volume on the breakout day: in 91% of candle types, patterns with heavy breakout-day volume did better than those with light volume.
Expecting a big move
A high reversal rate tells you price often turned. It says nothing about how far. Both engulfing patterns rank in the bottom quarter of 103 for performance after the break, so a reading that expects a lasting trend change from one engulfing pair is asking more of it than the record shows.
What a Test on the S&P 500 Found
A separate test by CXO Advisory looked at engulfing candles on the S&P 500 index from January 1962 to July 2010. It used a stricter, range-based definition: the second day had a higher high and a lower low than the first and closed in the top quarter of its range for bullish, or the bottom quarter for bearish. That is closer to the outside day than to the body rule above, which is worth keeping in mind.
It found 186 bullish and 184 bearish patterns over 48 years. Both pointed the right way for the first trading day after they formed, and the effect was weaker after 1990. Over the next 20 trading days the first-day move did not clearly persist.
The 200-day moving average changed the picture. The bullish pattern looked better when the index was below its 200-day average, with 65 such cases since 1962. After a bearish engulfing with the index above its 200-day average, the index tended to keep rising rather than fall. CXO's summary was that the signals were small, rare and noisy, and that it seemed unlikely a trader could exploit them at the portfolio level.
That fits Bulkowski's picture from a different angle. The candle often marks a short turn; the trend around it decides what happens next.
Reading an Engulfing Candle With Primo Trade
The questions this post keeps returning to are about context: what the trend was before the pair, where it sits in the recent range, and what the next session did. Those are the parts a single screenshot in a group chat rarely shows.
Primo Trade's Analyze Chart works from a photo or screenshot of a chart. The AI reads the trend, volatility, volume and sentiment, names the chart pattern it sees and explains what that pattern usually signals. That makes it a second read on the trend leading into an engulfing pair, not a verdict on where price goes next. If the AI reads a US ticker off the image, the full ticker analysis runs, with a signal, Primo Score and Trading Strategy beside the chart read.
Primo Trade gives AI-generated analysis for information and education. It is not financial advice. Markets carry risk; do your own research before you trade.
A screenshot holds only the candles in frame. Whether an engulfing pair sits near the yearly low depends on how much history you capture, so a wider view gives any reader, human or AI, more to work with. The candlestick patterns cheat sheet puts the engulfing pair next to the other common shapes on one page.
The Bottom Line
An engulfing candle is a second body that covers the first and closes the other way. After a decline it is bullish, after a rise bearish, and the wicks do not count.
In Bulkowski's data on US stocks, the bearish engulfing reversed the trend 79% of the time and the bullish engulfing 63%, yet both ranked in the bottom quarter of 103 patterns for how far price travelled afterwards. A test on the S&P 500 from 1962 to 2010 found a first-day effect that faded within days.
Most failures came from the same few places: the right shape in the wrong trend, a pair fighting the primary trend, no confirmation at the next open, and the expectation of a big move from a pattern that measured as a short turn. Read the trend first, the bodies second, and the next open third.