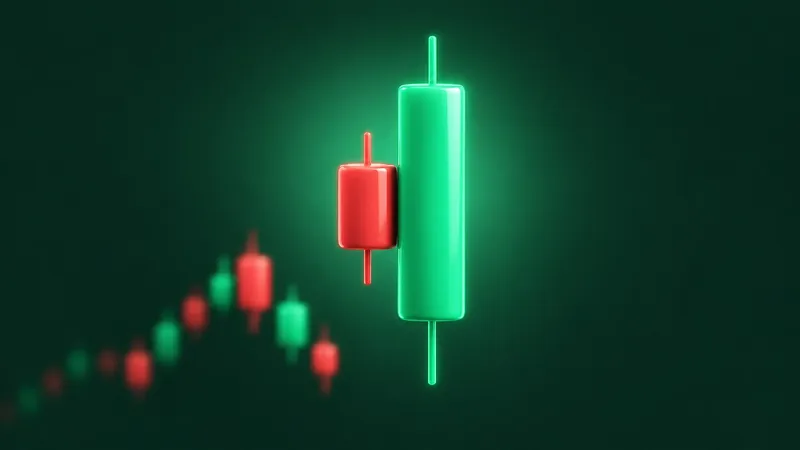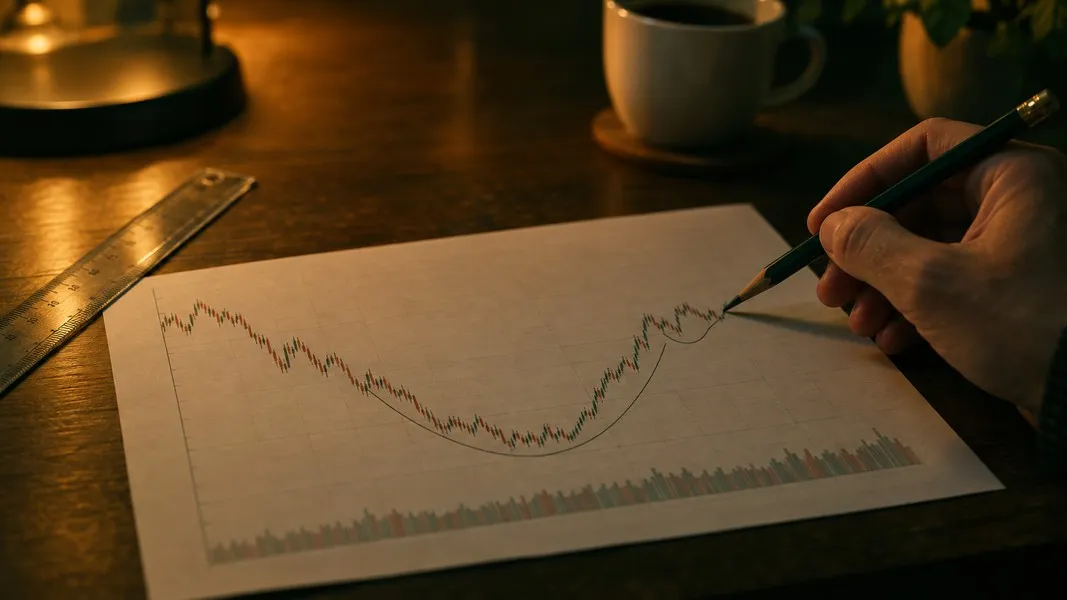
You have been watching a stock for months. It sank, curled back up in a slow, rounded bowl, drifted a little lower near the old high, then closed above it. A textbook cup and handle. Three weeks later the price is back inside the handle, and you are wondering what the textbook left out.
The cup and handle pattern is a rounded, U-shaped dip and recovery (the cup) followed by a short, shallow pullback near the old high (the handle). Traders read a close above the top of the handle as a bullish breakout. This guide walks through how each part forms, where the breakout line sits, what three well-known sources say the numbers should be, and the part most guides rush past: how often the breakout falls back.
What a cup and handle pattern looks like
Picture a stock that has been rising. It peaks, then slides lower over several weeks. The slide slows, flattens out at the bottom, and the price climbs back towards where it started. Drawn on a chart, that path looks like the side view of a teacup.
The two tops of the bowl are called the rims, or lips. The left rim is the old high; the right rim is where the recovery stalls. From that right rim the price drifts sideways or slightly down for a week or a few, on quiet trading. That small dip is the handle.
The pattern is complete only when the price closes above the top of the handle. Before that, it is a bowl and a wiggle with a hopeful name attached. Our guide to bullish and bearish chart patterns makes the same point about every shape: a pattern counts once the price crosses its line, not before.
The shape was popularised by William O'Neil, who founded Investor's Business Daily. IBD still teaches it as one of the main bases a growing stock builds before a new run, and its rules are the ones most other guides copy, loosen or argue with.
The cup: a slow U, not a V
The bowl is the part people get wrong first. Thomas Bulkowski, who has catalogued chart patterns for decades, puts it bluntly in his cup with handle guidelines: the cup should be U-shaped, not V-shaped, though he allows variations.
The reason is time. A V is a sharp drop and an equally sharp rebound, which tells you little about who is selling and who is buying. A U spends weeks near the bottom, which is where the idea behind the pattern lives: sellers run out, the price stops falling, and buyers slowly take it back up.
Depth matters too. IBD's chart pattern guide puts a normal cup between 12% and 33% below the left rim, and its course material allows 40% to 50% in a severe bear market. A cup much deeper than that is less a pause in an uptrend and more a stock that broke.
Then there is length. IBD's minimum is seven weeks. Bulkowski's guidelines run from 7 to 65 weeks. Fidelity's learning centre describes a cup lasting one to six months, occasionally longer. Nobody counts a three-day dip as a cup.
The handle: a short, shallow drift
The handle forms after the price climbs back near the left rim and stalls. It is a small pullback, and its job in the story is to shake out the people who bought at the old high and want out at break-even.
Three rules show up in nearly every source. The handle forms in the upper half of the cup; IBD adds that it should stay within 15% of the old high. Fidelity says it can give back up to a third of the cup's advance, and usually not more. And trading should be light while it forms: IBD wants volume to dry up in the handle.
How long? Bulkowski asks for one week at minimum, with no maximum. His trading tips add something more useful: the median handle in his data lasted 22 days, and stocks with handles shorter than that median showed better performance after the breakout. A handle that drags on and on is a handle that is losing its buyers.
A handle that sinks into the lower half of the cup is the clearest warning of all. At that point the stock has given back most of its recovery, and the "cup" is starting to look like an ordinary downtrend with a bounce in the middle.
Where the breakout counts
The breakout line is the top of the handle. IBD's Investor's Corner describes its buy point as the handle's peak plus ten cents. Bulkowski uses a close above the right cup rim, or an earlier close above a trendline drawn down across the handle's peaks.
Volume is the second half of the test. IBD looks for breakout volume at least 40% above the stock's average daily volume. A breakout on thin trading means few buyers stepped in at the new level, and a move with few buyers behind it is easy to reverse.
The opposite level matters just as much. Bulkowski names the handle low as a sensible place for a stop. If price falls back below the bottom of the handle, the story the pattern told has stopped being true. Our guide to what a stop-loss is covers how stop orders behave, including the ugly case where a stock gaps straight through one overnight.
Three sources, three sets of numbers
Here is how the three sources line up. They broadly agree on the shape and disagree on the details, which is worth knowing before you treat any single number as a law.
| Rule | IBD (O'Neil) | Bulkowski | Fidelity |
|---|---|---|---|
| Cup depth | 12% to 33% | Not stated | Not stated |
| Cup length | 7 weeks minimum | 7 to 65 weeks | 1 to 6 months |
| Handle position | Upper half, within 15% of the high | Upper half | Up to a third of the advance |
| Handle length | Not stated | 1 week minimum, median 22 days | 1 to 4 weeks |
| Breakout | Handle high plus ten cents, volume 40% above average | Close above the right rim | Move above the right rim on rising volume |
Sources: IBD chart pattern guide and Investor's Corner, thepatternsite.com, Fidelity Learning Center, all as published on their pages.
None of these is the official definition, because there isn't one. A shape that passes Fidelity's test can fail IBD's, so when someone calls a chart a cup and handle, it is fair to ask whose rules they mean.
The measure rule and its limits
Most guides add a price target. Fidelity's technical indicator guide takes the distance from the right top of the cup down to its bottom and adds it to the breakout point, and says plainly that this should be used only as a guideline.
Bulkowski's numbers show why. In his bull market statistics, 61% of cup with handle patterns reached the target that rule sets. That means roughly four in ten did not. A target is a ruler laid on a chart, not a forecast.
When the cup and handle fails
Bulkowski's headline figure for this pattern looks reassuring: a break-even failure rate of 5%, based on 913 "perfect trades" in a bull market, and an overall performance rank of 3 out of 39 patterns. Read alone, that sounds like the pattern almost never goes wrong.
Now look at the trading lesson on the same page. Bulkowski studied 300 cup with handle patterns from 1990 to March 2024 and found that 47% dropped substantially within two months of the breakout. Almost a quarter, 23%, rose no more than 15% before dropping.
Both numbers can be true at once. A break-even failure means the price never rose meaningfully past the breakout at all. A stock can clear that bar comfortably, then give most of it back a few weeks later. "The pattern worked" and "the stock fell back hard" describe the same chart, measured on different days.
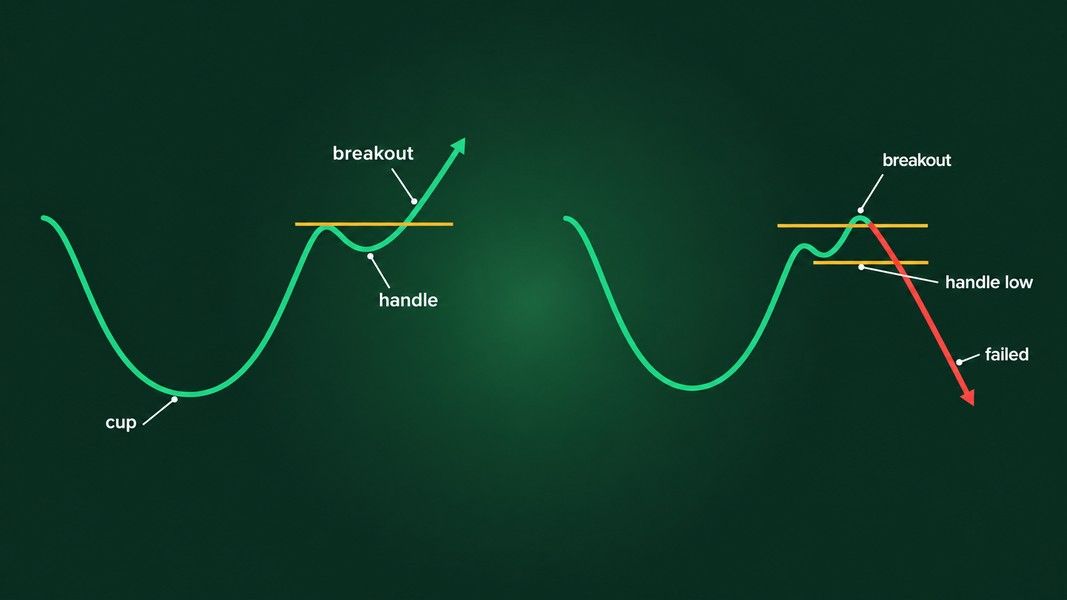
Throwbacks are the other half of the picture. A throwback is the price returning to the breakout level after an upward breakout, and Bulkowski measured a throwback rate of 62% for this pattern, adding that throwbacks hurt performance. So a dip back towards the breakout line is not a rare event. It is the more common path.
A failed cup and handle, read after the fact
Bulkowski illustrates the lesson with real charts. In one, Valaris (VAL) completed a valid cup with handle, broke out upward, then plunged far enough to bust the breakout entirely. In another, Williams-Sonoma (WSM) broke out, rose, and then retraced 15%, a drop he notes looks small on the chart but is not.
A third example, Allstate, shows the slow version: the price closes above the handle, sinks back to about the middle of the handle, rises to a new high, and only then drops hard. Anyone judging that pattern a week after the breakout would have called it a success, and anyone judging it two months later would not.
The lesson is not that the pattern is useless. It is that the breakout is the start of the question, not the answer. What a trader does at the handle low, and after the first throwback, decides far more than the shape does.
Five signs a cup and handle formation is weak
None of these makes a failure certain, and a clean pattern can still fail. They are the details the sources above flag as weaker setups:
- A V instead of a U. A sharp bottom skips the slow turn the pattern is built on.
- A cup that is too deep. Past IBD's range of roughly a third below the old high, outside a bear market, the stock has done real damage.
- A handle in the lower half. IBD and Bulkowski both want the handle in the upper half of the cup.
- A long, sagging handle. Bulkowski's data favoured handles shorter than the 22-day median.
- A breakout on thin volume. IBD wants at least 40% more volume than average on the breakout day.
If you want the shape beside its relatives, our chart patterns cheat sheet draws the cup and handle next to the double bottom, the flag and the other common patterns, with what confirms each one.
The inverted cup and handle pattern
Flip the chart upside down and you get the inverted cup and handle, the bearish mirror image. Bulkowski's inverted cup guidelines describe a smooth, rounded turn shaped like an upside-down bowl, two cup rims that bottom near the same price, and a handle to the right of the cup.
Here the price rises, rounds over, and falls back to roughly where it began. The handle is a small bounce, and the breakout that counts is a close below the bottom of the pattern.
The same caution carries over. On one of his weekly examples, Bulkowski eyeballs the drop after the breakout as 35%, and on another notes that the inverted cup was not as rounded as he likes, nor the drop large. Upside down or right side up, the shape describes what has happened, and the price decides the rest.
Reading a cup and handle stock pattern from a chart photo
Spotting a cup is easy after the fact and hard in real time, because the right side of the bowl is still being drawn. Is that drift a handle, or the start of a deeper slide? A second read helps most at exactly that point.
Primo Trade reads a photo or screenshot of a chart and gives the AI's view of the trend, volatility, volume and sentiment it sees, the chart pattern it recognises, and what that pattern usually signals. The result also includes a signal, a Primo Score and a Trading Strategy idea with a risk level. If it reads a US ticker on the image, the full ticker analysis runs, with recent news and the model's 6 to 12 month estimate.
Primo Trade gives AI-generated analysis for information and education. It is not financial advice. Markets carry risk; do your own research before you trade.
Treat that read the way you would treat any of the rules above: as a description of what is on the chart today. Primo Trade can name the shape; whether the breakout holds is something nobody's chart reading settles in advance.
The short version
A cup and handle pattern is a slow, U-shaped dip and recovery followed by a short, shallow pullback near the old high, and it counts only once the price closes above the top of the handle. IBD wants a cup 12% to 33% deep, at least seven weeks long, a handle in the upper half and breakout volume at least 40% above average. Bulkowski and Fidelity agree on the shape and differ on the numbers.
The failure statistics matter as much as the rules. Bulkowski's 5% break-even failure rate sits beside his finding that 47% of 300 patterns dropped substantially within two months, and a 62% throwback rate. Watch the handle low, expect a dip back to the breakout line, and judge the pattern by what happens after it completes, not by how clean the bowl looks.