In December 2024, a chart blog called Nvidia's daily chart a textbook head and shoulders. It is the most famous bearish shape in the book. Six weeks later, was it right?
The honest answer is that it depends on which day you asked. That is the whole story of bullish and bearish chart patterns in one stock: a shape the price has already drawn, a name for it, and a lot of room between the name and what happens next.
This guide walks through the patterns you will meet most often, each one beside the lookalike that fools people, with the numbers one practitioner has published on them and what academic studies found when they tested them.
Bullish vs Bearish: What the Labels Actually Claim
A chart pattern is a shape drawn by the price over weeks or months: three peaks with the middle one highest, two dips at the same level, two lines closing in on each other. A bullish pattern is one traders say tends to come before a rise. A bearish one is said to come before a fall.
Notice the "said to". The label describes a tradition, not a law. Andrew Lo, Harry Mamaysky and Jiang Wang, writing in the Journal of Finance in 2000, put the core problem plainly: the shapes in a price chart are often in the eyes of the beholder. Two people can look at the same chart and see different patterns, or none.
So every useful pattern comes with a rule for when it counts. Until the price crosses a specific line, you are looking at squiggles with a name attached. If you want every shape on one page, our chart patterns cheat sheet draws them side by side.
Five Patterns and the Lookalikes That Fool People
Here are the shapes this guide covers, what has to happen before each one counts, and the impostor that looks the same until it does not.
| Pattern | Taught as | Counts once the price | Its lookalike |
|---|---|---|---|
| Head and shoulders top | Bearish | Closes below the neckline | Three bumps that bounce off the neckline and climb |
| Head and shoulders bottom | Bullish | Closes above the neckline | Three dips that roll over before the line |
| Double bottom | Bullish | Closes above the peak between the two lows | Two dips that never clear the middle peak |
| Descending triangle | Bearish | Closes outside either trendline | The same triangle breaking upward |
| Cup with handle | Bullish | Rises above the right lip of the cup | A breakout that hands the whole rise back |
The right column is where most of the pain lives. Let's take them one at a time.
Head and Shoulders: The Real One and the Fake
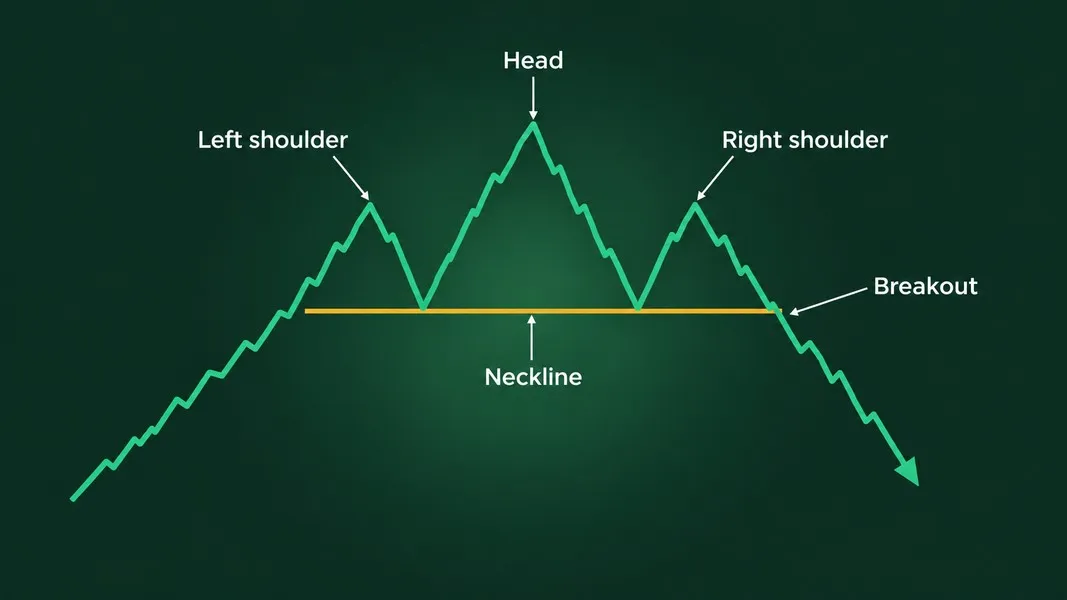
A head and shoulders top is three peaks in a row, the middle one (the head) higher than the two beside it (the shoulders). A line under the two troughs between the peaks is the neckline. The pattern is read as a rise turning into a fall, and practitioners have long called it one of the most reliable patterns, as a New York Fed staff report by Carol Osler and Kevin Chang notes.
The catch is the word "complete". The pattern only counts once the price closes below the neckline. Before that, it can just as easily bounce off the line and climb past the head. How often does the fake version happen? More often than the textbooks let on, as the computer test further down shows.
Thomas Bulkowski, who has cataloged chart patterns for decades on his pattern site, adds a second check: the price must have something to reverse. Three bumps after a long climb mean more than three bumps in a market that has been going sideways for a year.
The mirror image, a head and shoulders bottom, has three troughs with the deepest in the middle and is read as bullish. The same rule applies upside down: it counts once the price closes above the neckline.
A Real Head and Shoulders That Changed Its Mind: Nvidia, Late 2024
This is a closed window from December 2024 to January 2025, read after the fact. It is not a view on Nvidia today.
On December 15, 2024, the Keystone Speculator blog called Nvidia's daily chart a textbook head and shoulders and put numbers on it: a neckline near $132, a head near $150, and a measured target of $114 if the neckline gave way. On Christmas Eve the same blog noted the stock had dipped to $126.86 and bounced back to about $140.
Then the stock did two opposite things in three weeks.
On January 6, 2025, Nvidia closed at a record $149.43, Yahoo Finance's daily price history shows. That beat the head's best close of $148.88 on November 7. The right shoulder was supposed to stay below the head, and on a closing basis it had grown into a new high. Anyone grading the pattern that evening would have filed it under failed.
On January 27, after China's DeepSeek shook AI chip stocks, Nvidia fell 17% in a single day to $118.42, The Wall Street Journal reported in its market coverage. That was far below the $132 neckline and not far above the $114 target.
Read on January 6, the head and shoulders looked failed. Read on January 27, the price had fallen past the neckline toward the drawn target. A strict reader would say the December pattern died when the price made a new high, and the January drop was a new story driven by news. A loose reader would say the top just took its time. Both readings exist because the shape could not contain the thing that actually moved the price: news that nobody drawing lines in mid-December could have known.
Double Bottom or Just Squiggles
A double bottom is two lows at roughly the same price with a peak between them, like a W. It is read as bullish: sellers pushed the price down twice and could not break through.
Its lookalike is so common that Bulkowski gave it a blunt name. On his Adam and Adam double bottom page, he writes that the twin dips become a true double bottom only when the price closes above the peak between them. Until then, in his words, the squiggles on the chart are just squiggles.
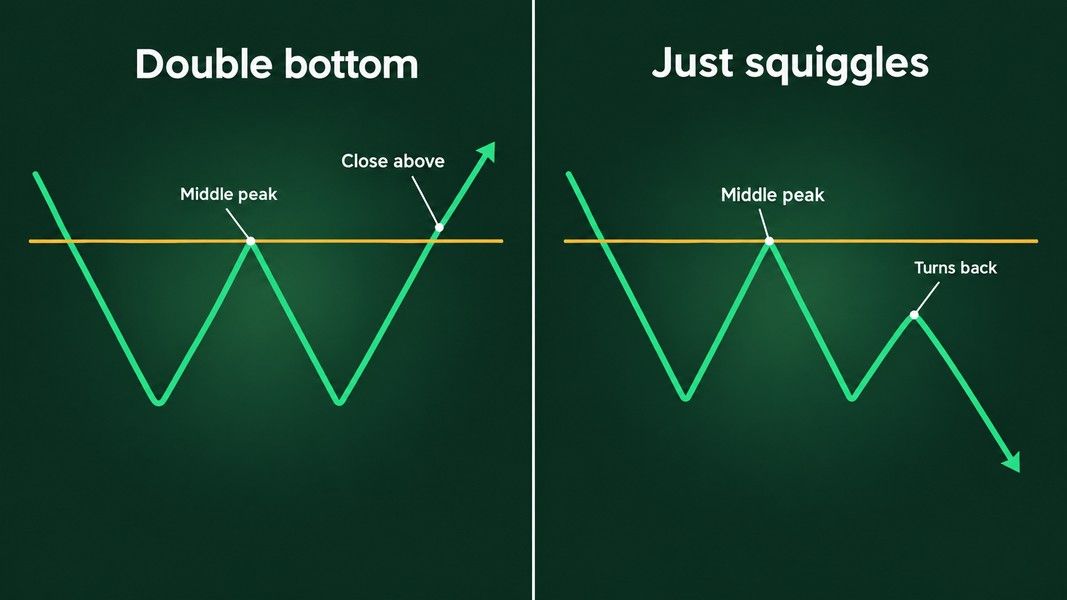
His sample shows why waiting matters. If you buy before that confirmation, he puts the chance of the price continuing lower at 48%. That is close to a coin flip, on a pattern that is taught as bullish.
Triangles: Same Shape, Either Direction
A triangle forms when the highs and lows start to converge between two trendlines. In a descending triangle, the lower line is flat and the upper line slopes down. An ascending triangle is the mirror: a flat upper line and a rising lower one.
Descending triangles are usually taught as bearish. In Bulkowski's own sample, the price actually broke out upward 53% of the time, his triangle page shows. The shape on its own did not decide the direction.
He also lists what makes one count: at least three touches of one line and two of the other, and a close outside a line to confirm it. His page adds a sobering note: the pattern's performance has dropped almost in half since the 1990s. A shape that everyone knows tends to stop surprising anyone.
The lesson for a triangle is simple. Do not decide the direction from the slope of the lines. Let the close outside the triangle decide, and know in advance what you will do if it goes the other way.
Cup with Handle: When a Success Is Also a Drop
A cup with handle is a rounded dip, like the side view of a teacup, followed by a smaller dip on the right (the handle). The breakout comes when the price rises above the right lip of the cup, and the pattern is read as bullish.
On paper it is one of the best performers Bulkowski tracks: a break-even failure rate of 5% across 913 trades. Then you read further down the same page. In a separate study of 300 cups with handles from 1990 to March 2024, he found that 47% dropped substantially within two months of the upward breakout, and almost a quarter rose no more than 15% before dropping.
Both numbers can be true at once. The failure rate only asks whether the price ever cleared 5% after the breakout. A cup that rose 6% and then fell back below the breakout counts as a success in the first number and as a drop in the second. The target drawn from the cup's depth was reached by only 61% of the cups he measured.
Bulkowski's Numbers, With the Fine Print Attached
Bulkowski publishes a break-even failure rate for each pattern: the share of patterns where the price failed to move at least 5% in the expected direction after the breakout, as his glossary defines it. Here are his bull-market figures for the patterns above.
| Pattern | Break-even failure rate | Reached the measured target | Sample, bull markets |
|---|---|---|---|
| Head and shoulders top | 19% | 51% | More than 2,800 trades |
| Descending triangle, up / down breakout | 22% / 23% | 64% / 50% | More than 1,300 trades |
| Double bottom, Adam and Adam | 16% | 73% | 1,154 trades |
| Cup with handle | 5% | 61% | 913 trades |
Read this table as a description of his past samples, measured on his own rules. It is not a forecast for the next chart you see, and it is not peer reviewed. Four details change how the numbers feel:
- Bull markets only. His glossary defines a bull market as everything outside the 2000 to 2002 and 2007 to 2009 bear markets, so these figures leave out the worst stretches.
- Perfect trades. He measures from the breakout to the ultimate high or low, which assumes buying at exactly the breakout and selling at exactly the top. No real trader does that.
- Pullbacks hurt. When the price comes back to the breakout level soon after breaking out, he notes, the move afterwards tends to be weaker.
- Targets are rough. Even on his own rules, the head and shoulders target was met about half the time.
What Academic Studies Found
So did anyone test this properly? Three teams of researchers did, with computers doing the looking instead of eyes.
Some information, not a money machine
Lo, Mamaysky and Wang built a computer method to detect patterns objectively and ran it on a large number of US stocks from 1962 to 1996. They compared what happened after patterns like head and shoulders and double bottoms with what happened otherwise, and concluded that several of them provide incremental information and may have some practical value.
That is a careful phrase. It means the spread of daily price moves after a pattern looked different from the usual spread. The paper does not claim that trading the patterns paid off.
Head and shoulders, tested by computer
Osler and Chang tested a computer-identified head and shoulders rule on daily exchange rates of six currencies against the dollar from 1973 to 1994. It is a currency study, not a stock study, but the way it counts patterns applies to any chart.
Their program found plenty of head and shoulders shapes. Only 25 to 40 percent of them, depending on the currency, were confirmed by a break of the neckline within the time window their rules allowed. Most of the shapes did not finish in time to count. The rule had predictive power for the German mark and the Japanese yen but not for the other four. The same report found that another common claim, that the pattern's price target has predictive power, was not supported by the data.
The data snooping problem
Try enough rules on the same price history and some will look good by chance. Ryan Sullivan, Allan Timmermann and Halbert White tackled this in a Journal of Finance paper from 1999 that tested a large universe of trading rules on 100 years of daily Dow Jones data, adjusting for every rule tried, not only the one that looked best.
The same trap waits for anyone scanning charts by eye. The more shapes you look for, the more you will find, and some of them will have worked in the past by luck alone.
How to Read a Pattern Without Fooling Yourself
None of this means patterns are useless. A head and shoulders tells you something true about the past: buyers tried to push past an earlier high and failed. That is context. The mistake is treating it as a forecast.
Most of the discipline is patience. A daily candle is not finished until the market closes, so the honest time to grade a pattern is the evening, not the middle of the session.

Before you call a shape bullish or bearish, run through this:
- Name the lookalike. For every pattern you see, ask what the impostor would look like, and what would tell the two apart.
- Wait for the close. A pattern counts when the price closes beyond the neckline or trendline, not when it touches it. A screenshot taken during the trading day shows a last candle that is still forming, so any read of it, a photo read in Primo Trade included, can name the shape but cannot tell you whether it counts yet.
- Check what came before. A reversal pattern needs a trend to reverse.
- Treat the target as a sketch. Even on Bulkowski's rules, targets were met somewhere between half and three quarters of the time.
- Decide where you are wrong before you start. Our guide to what a stop-loss is explains one way traders set that point in advance.
Patterns are built from candles, so if you are new to reading them, start with how to read candlestick charts.
If you want a second read of a chart in front of you, Primo Trade can look at a photo or screenshot of it and name the chart pattern its AI sees, along with what that pattern usually signals. The same rules apply to that read: a name is an interpretation, not a confirmation, and our article on how AI reads a stock chart explains where it can go wrong.
Primo Trade gives AI-generated analysis for information and education. It is not financial advice. Markets carry risk; do your own research before you trade.
Conclusion
Bullish and bearish chart patterns are names for shapes the price has already drawn. Each one has a twin that looks the same until the price closes past a line: the head and shoulders that bounces off its neckline, the double bottom that never clears its middle peak, the bearish triangle that breaks upward about half the time.
Practitioner counts show these patterns fail often enough to matter and reach their targets roughly half to three quarters of the time. Academic studies found a little information in some of them, in some markets, and warned that testing many shapes on the same history will always turn up a few that worked by luck. The Nvidia chart from the winter of 2024 shows the rest: the same pattern can look failed one week and confirmed three weeks later, depending on the day you stop reading. Use patterns to describe what the price has done, and weigh them as one piece of evidence among several.