You drew support at $50.00, set your stop a few cents under it, and watched the stock dip to $49.70, take you out, then close the day back above $51. The level did its job. You just treated it like a wire when it behaves more like a mattress.
Support and resistance are price areas where buying or selling has stopped a move before, and where resting orders tend to sit waiting for price to come back. They are among the oldest ideas in chart reading, and they hold up better than most. The trouble is the folklore that grew around them: lines drawn to the cent, levels that get stronger forever, magic round numbers, a retest you can count on.
Below are five beliefs about where price turns, each set against what researchers and pattern statisticians actually measured, and what to do instead.
What support and resistance trading is built on
Support is the price where demand has been strong enough to stop a decline. Resistance is where selling has been strong enough to stop a rise. That is close to how StockCharts' ChartSchool defines them, and it is the version most traders learn first.
Why should an old turning point matter today? The most useful answer comes from the order book rather than from crowd psychology. Kenneth Kavajecz and Elizabeth Odders-White showed in a 2004 study that support and resistance levels coincide with peaks in depth on the limit order book. They also found the relationship runs one way: the technical rules were locating depth that was already in place, not creating it.
In plain words, the lines traders draw tend to land where buy and sell orders are already stacked. That framing explains most of what follows. Orders are spread across a range of prices, they get filled, and they get cancelled. A level is only as strong as the orders still sitting there.
Myth 1: Support and resistance are exact lines
The belief: if the stock bounced at $50.00 twice, it will turn at $50.00 again, and a single cent below means the level is broken.
What the evidence shows
Even the people who teach the textbook version hedge on this. ChartSchool's own guidance is that sometimes exact levels work best and sometimes zones do, and that the tighter the trading range, the more exact the level can be. They suggest exact levels mainly for ranges that span less than two months and stay tight.
The order book research points the same way. Orders cluster around a price, not on one tick of it. The study in Myth 2 below even defines a level as a price interval rather than a single price.
What to do instead
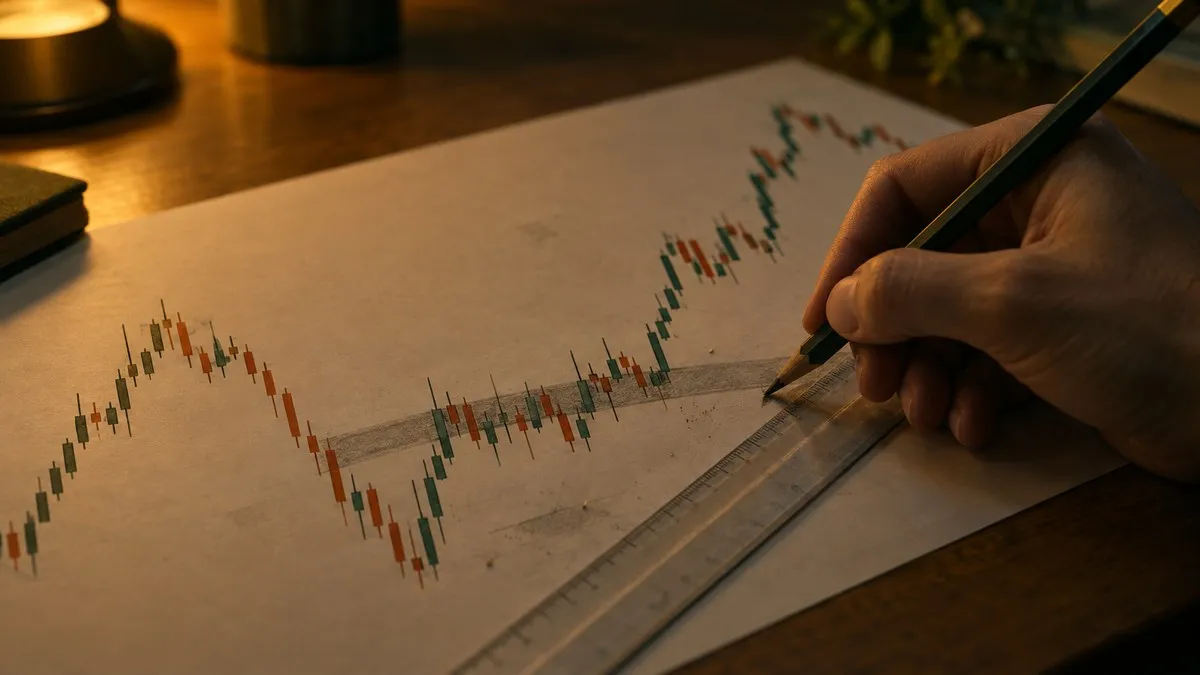
Draw a band, not a line. A common way is to mark the zone from the lowest wick to the lowest candle body in the cluster of lows, so the band covers where price actually reversed rather than one number you picked.
Then think about where your exit sits. A stop placed a few cents under an obvious line sits where many other stops sit, and a stop that triggers becomes an order to sell at whatever price is available. If you want the detail on that, here is how stop orders work when price gaps through them.
Myth 2: Every touch makes a level stronger
The belief: the third touch is stronger than the second, the fifth stronger than the third. Some traders hold the opposite belief, that each test chips away at the level until it breaks. Both are stated with confidence; the evidence sits in between.
What the evidence shows
Ken Chung and Anthony Bellotti tested this directly in a 2021 paper. They used minute-by-minute prices from 2018 for three assets: Lloyds Banking Group shares on the London Stock Exchange, Brent crude oil and the euro to dollar rate. Price entering a level with more previous bounces was more likely to bounce again, and the effect was statistically different from the same price series with its price changes shuffled.
There was a catch. The memory faded. Bounces measured over a longer look-back window were weaker predictors of the next bounce than recent ones, and how fast that decay happened depended on the asset. For the Lloyds shares the decay was slow and hard to see at all; for oil and the currency it was clearer.
What to do instead
Treat the number of touches as a tiebreaker between two levels, not as a promise. Give recent touches more weight than old ones, and keep the limits of the study in mind: one year, minute bars, three assets, one of them a stock. That says something about how levels behave intraday. It says much less about a level drawn on a weekly chart five years ago.
Myth 3: Round numbers are natural support and resistance
The belief: $100, $50 and Dow 30,000 are walls because people think in round numbers, so price stalls there.
What the evidence shows
This one has real research behind it, and the research disagrees with itself. R. Glen Donaldson and Harold Kim studied the Dow Jones and found that the index's rise and fall was restrained at multiples of 100, such as 2,800, 2,900 and 3,000. Once a 100-level broke, the index then moved by more than otherwise expected. So the round number acted as a barrier and then as a springboard.
Eduardo Ley and Hal Varian looked at 41 years of Dow closes, from January 1952 to June 1993, in a 1994 paper. At first the century marks looked more like a launch pad than a barrier, but the pattern did not hold up across subsamples. Their conclusion was that there is "little if any predictive power in the closing values" of the index.
Both studies looked at an index, not at a single stock, and both are decades old.
What to do instead
Treat a round number as a place where orders might cluster, which fits the order book research above. Give it weight only when price has actually reacted there on your chart. A round number that price has sliced through three times without pausing is just a number.
Myth 4: Broken resistance always comes back as support
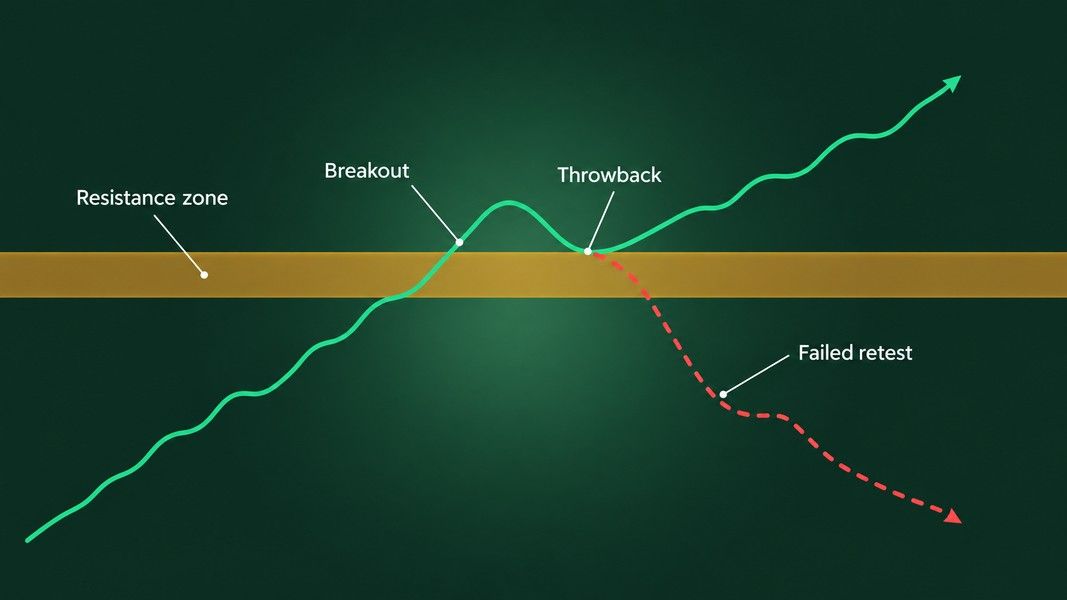
The belief, often called role reversal: once price breaks above resistance, it will come back to test that level from above, and the old ceiling will act as a floor. Many traders plan their entry around that retest.
What the evidence shows
Thomas Bulkowski, who has catalogued chart patterns for decades, measured this return trip and calls it a throwback when it happens within 30 days of an upward breakout. Since 2000, 58% of 10,305 chart patterns with upward breakouts in his data had a throwback. Price climbed for 6 days on average before turning back, and the whole round trip took about 10 days.
Read the other side of that number: about 4 in 10 breakouts never came back to offer the retest. And of those that did return to the breakout price, 35% kept falling below the chart pattern. Worked through, that is roughly one in five of all the upward breakouts in his sample where the old resistance did not hold as support. Bulkowski names overhead resistance as the chief cause of a throwback in the first place.
What to do instead
Plan for three outcomes, not one: no retest, a retest that holds, and a retest that fails. If your whole plan depends on the retest, you will either miss the move or buy the failed one. The same logic applies to the neckline of a pattern; this walkthrough of double bottom breakouts shows what a confirmed break and a failed one look like side by side.
Myth 5: A big-volume breakout is the one that sticks
The belief: a break through support or resistance on light volume is suspect, and one on heavy volume is the real thing.
What the evidence shows
Bulkowski tested this too, in a volume study of over 8,000 chart patterns from July 1991 to May 2011. He kept only rectangles and double and triple tops and bottoms, patterns where the breakout level is clearly defined, and compared breakout-day volume with the previous 31 calendar days.
The results ran against the textbook. Measured by how often price failed to move more than 10% after the breakout, upward breakouts on above-average volume failed 14% of the time against 5% on below-average volume. For downward breakouts it was 28% against 11%. Throwbacks followed 57% of high-volume upward breakouts against 18% of low-volume ones, and pullbacks after downward breaks showed the same split, 47% against 17%.
What to do instead
Read heavy volume at a break as a sign that a lot of orders traded through the level, not as a verdict on direction. In this sample a loud breakout was more likely to come back and test the level, so the third outcome from Myth 4 deserves more weight after a high-volume break, not less.
How to read levels with less faith
Here is the whole list in one place, with the sample behind each finding.
| Myth | What was measured | Sample |
|---|---|---|
| Levels are exact lines | Levels coincide with peaks in resting order depth | Kavajecz and Odders-White, limit order book data |
| Every touch adds strength | More prior bounces, more bounces next, but the effect fades | Chung and Bellotti, minute data, 2018, three assets |
| Round numbers are walls | Dow restrained at 100-levels in one study, no predictive power in another | Dow Jones closes, 1952 to 1993 |
| Broken resistance becomes support | 58% returned to the breakout; 35% of those kept falling | Bulkowski, 10,305 patterns since 2000 |
| High volume confirms a break | High-volume breaks failed and threw back more often | Bulkowski, 8,000+ patterns, 1991 to 2011 |
Every figure here is a past frequency from a named sample. None of it tells you what the next stock you look at will do.
In practice, that leaves a short working method:
- Mark zones from clusters of reversals, and weight recent reversals over old ones.
- Count a round number only where price has visibly reacted to it.
- Before a breakout, write down what you will do if there is no retest, a retest that holds, and a retest that fails.
- Treat breakout volume as information about activity, not as confirmation.
Where an AI read fits
If you want a second read on a chart you have already marked up, Primo Trade can take a photo or screenshot of it. Its Analyze Chart feature gives the AI's read of trend, volatility, volume and sentiment, the chart pattern it sees and what that pattern usually signals, along with a Primo Score and Key Insights. It does not replace your own levels; it gives you another view to set beside them. If you want to look up a pattern by its shape, the chart patterns cheat sheet lays out the common ones.
Primo Trade gives AI-generated analysis for information and education. It is not financial advice. Markets carry risk; do your own research before you trade.
The short version
Support and resistance are real enough to study and loose enough to mislead. They mark where orders tend to rest, so they behave like zones, not lines. Touches matter, but recent ones matter more and the effect fades. Round numbers have mixed evidence and deserve weight only when price reacts to them. The retest after a breakout happened in a little over half of one large sample, and a third of those retests failed. Heavy volume at a break made a return trip more likely, not less. Draw the zone, plan for each outcome, and hold every level a little more loosely than the chart makes it look.