At 2:47 p.m. on May 6, 2010, shares of Procter & Gamble, about as sleepy a blue chip as Wall Street has, traded at $39.37, as CNBC reported that evening. A few minutes earlier they had been above $60. Soon after, they were back above $60 as if nothing had happened.
By the close, the whole episode had shrunk into one candle on P&G's daily chart: a small body sitting on a tail so long it looks like a printing error. If you know how to read candlestick charts, you can read that day in two seconds. If you know a little of the textbook, you may also be tempted to call it a hammer and wait for a bounce.
This guide is about the first skill, and about why the second deserves suspicion: a candle is an excellent record of what happened and a much weaker clue about what happens next.
How to Read Candlestick Charts: The Four Prices in Every Candle
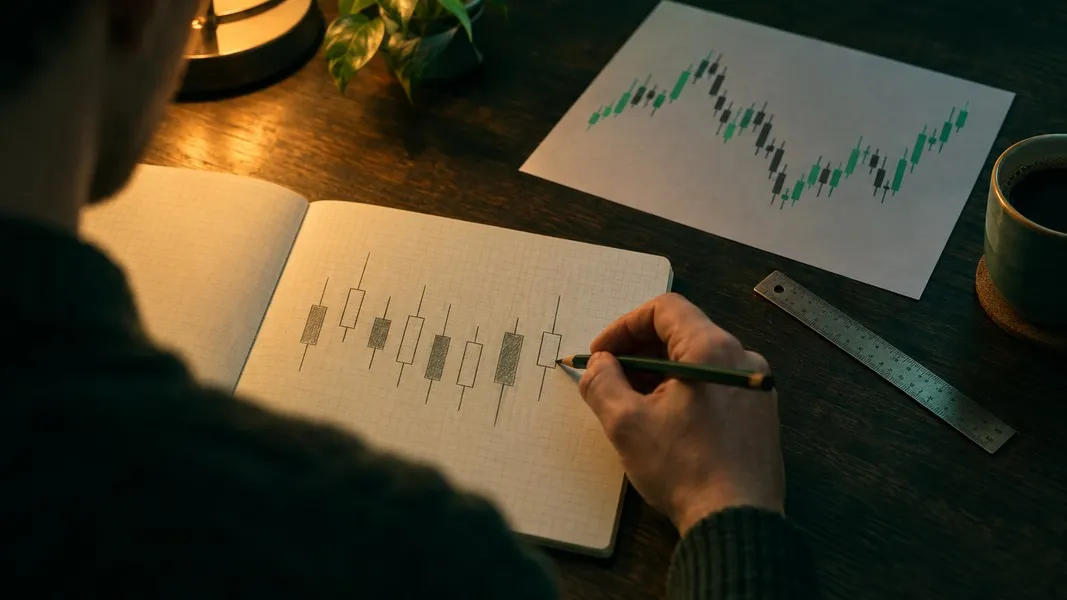
Each candle covers one period: a day, an hour, five minutes, whatever the chart is set to. To draw it, the chart needs four numbers for that period, the open, the high, the low and the close, as the StockCharts ChartSchool explains.
That is the whole alphabet. Everything else on a candlestick chart is those four numbers, drawn again and again.
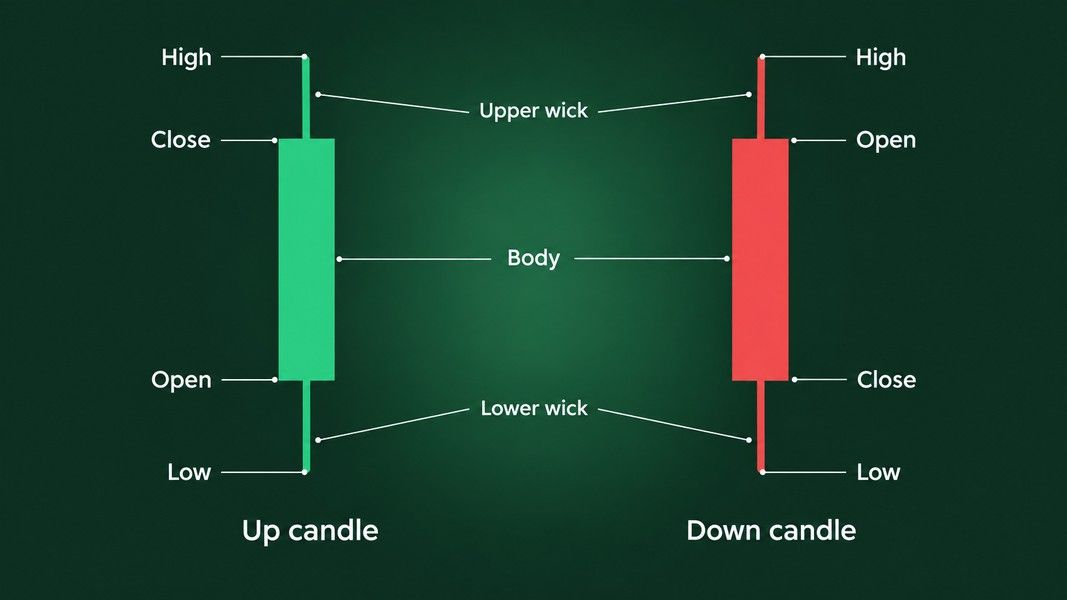
The body
The thick part is the body, sometimes called the real body. It runs from the open to the close.
If the close is above the open, the price rose during the period. Most charts draw that candle green or hollow, with the open at the bottom of the body and the close at the top. If the close is below the open, the price fell, and the candle is red or filled with the open at the top. Colors are a software setting, not a law, so check yours before you trust them.
Body length is distance. A long body means the price traveled a long way between open and close. A short body means the two ended up close together, which CME Group's course reads as not much strength in the move either way.
The wicks
The thin lines above and below the body are the wicks, also called shadows or tails. The tip of the upper wick is the highest price traded in the period, and the tip of the lower wick is the lowest.
Wicks show the part of the move that did not hold. A long upper wick means buyers pushed the price up during the period and sellers dragged it back before the close. A long lower wick is the mirror case: sellers pushed it down and buyers brought it back. CME adds a useful reading of where the body sits: a small body near the top of the range means buyers had taken control by the end of the period, and a small body near the bottom means sellers had.
When there are no wicks
A candle with no wicks is a marubozu, a Japanese word the StockCharts dictionary translates as close-cropped. In a green marubozu the open was the low and the close was the high, so buyers held control from the first trade to the last. A red marubozu is the reverse.
What a candle hides
ChartSchool makes a point most guides skip: two very different days can draw the same candle. A small dip, a big rally and a small fade can leave exactly the same open, high, low and close as a big rally, a crash and a full recovery. The candle keeps the four prices and throws away the order they came in, and it never tells you why any of it happened.
The same limit follows the candle into a photo. Snap a chart for Primo Trade's AI read, or for any other reader of chart images, and the picture carries the shapes, not the order of the trades inside each candle.
Which brings us back to P&G.
Read a Real Candle: Procter & Gamble on May 6, 2010
Here is P&G's daily price history around that afternoon, from Yahoo Finance, with prices as traded rather than adjusted for dividends.
| Day | Open | High | Low | Close | Volume |
|---|---|---|---|---|---|
| Wed, May 5 | $61.62 | $62.57 | $61.50 | $62.16 | 11.6 million |
| Thu, May 6 | $61.91 | $62.67 | $39.37 | $60.75 | 28.6 million |
| Fri, May 7 | $60.61 | $61.20 | $60.00 | $60.31 | 24.0 million |
| Mon, May 10 | $61.57 | $62.70 | $61.16 | $62.42 | 16.0 million |
Read the May 6 candle out loud: opened at $61.91, went up to $62.67, down to $39.37, closed at $60.75. The close is below the open, so the body is red, and it is short, just $1.16. The upper wick is 76 cents. The lower wick runs $21.38, more than 18 times the length of the body, on about two and a half times the previous day's volume.
The shape says hammer
By shape alone, that is a textbook hammer or hanging man: a small body near the top, a long lower wick, almost nothing above. Now look left. P&G had closed at $62.68, $61.71 and $62.16 from Monday to Wednesday that week. There was no decline for a hammer to end and no rally for a hanging man to top, so by the book it is neither.
The cause says something else
That evening, CNBC's sources had a culprit: a trader who typed "b" for billion instead of "m" for million, in a trade possibly involving P&G. It was a neat story about one stock. The SEC and CFTC staffs' joint report, published that September, told a bigger one.
The selling started in the futures market, where a large trader began a program at 2:32 p.m. to sell 75,000 E-Mini S&P 500 contracts, worth about $4.1 billion, into an already stressed market. P&G's own slide did not begin until 2:44 p.m., after the broad indices had started their drop at about 2:40. The stock was a casualty, not the cause.
Once it started, P&G fell from more than $60 to $39.37 in about three and a half minutes, a 36.14% drop from its 2:40 p.m. price, then recovered above $60 in about a minute.
It had plenty of company. More than 20,000 trades across over 300 securities were executed more than 60% away from their prices moments before, and those trades were later cancelled. P&G's drop stopped short of that line, so its trades stood, and the $39.37 low is still printed on its chart.
What came next
What followed was not much. P&G closed at $60.31 the next day and $62.42 the Monday after, right back in the range it had traded in all week. Anyone who read the long wick as buyers defending the stock, or as the start of a turn, was reading a story into a market malfunction.
The candle recorded what happened perfectly. It said nothing about why. That is the whole method in one example: read the four prices precisely, then ask what else you would need to know before they mean anything.
Candlestick Patterns Built From One Candle
Traders give names to candles with a recognizable shape. Each name describes the period that just ended, and most of them depend on what came before.
Doji
A doji forms when the open and the close are virtually equal, so the body shrinks to a line and the candle looks like a cross or a plus sign. StockCharts calls a doji neutral on its own: any reading of it depends on the price action before it and on what happens after.
Two variants have their own names. A dragonfly doji has a long lower wick and no upper one, like a letter T. A gravestone doji is the opposite, a long upper wick with nothing below.
Where you see one matters more than its name. A doji on a five-minute chart can be nothing more than a quiet stretch before lunch. A doji on a weekly chart means a whole week of buying and selling ended almost exactly where it began. Same cross, very different amount of argument behind it.
Spinning top
A spinning top has a small body with wicks on both sides that are longer than the body. Buyers and sellers both moved the price during the period and neither held the move, so it is read as indecision.
Hammer, hanging man and their upside-down twins
These are the lookalikes that catch everyone out. The shape is identical; only the trend before it changes the name.
| Shape | After a decline | After a rise | What the period recorded |
|---|---|---|---|
| Small body, long lower wick, little or no upper wick | Hammer | Hanging man | The price was pushed well down and came back by the close |
| Small body, long upper wick, little or no lower wick | Inverted hammer | Shooting star | The price was pushed well up and fell back by the close |
| Open and close almost equal | Doji | Doji | Both sides moved the price and the close ended near the open |
StockCharts treats all four of the named reversal candles as needing confirmation from the candles that follow. For the shooting star it adds that the upper wick should be at least twice the length of the body before the shape means much. P&G's lower wick was 18 times its body, which shows that a dramatic wick on its own proves nothing.
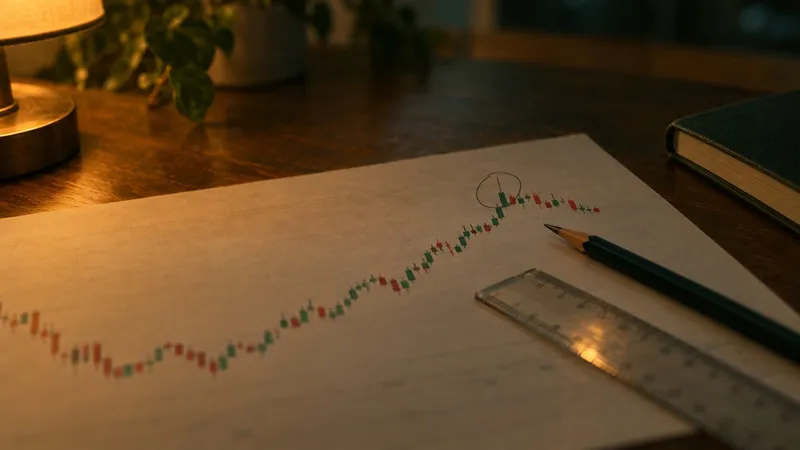
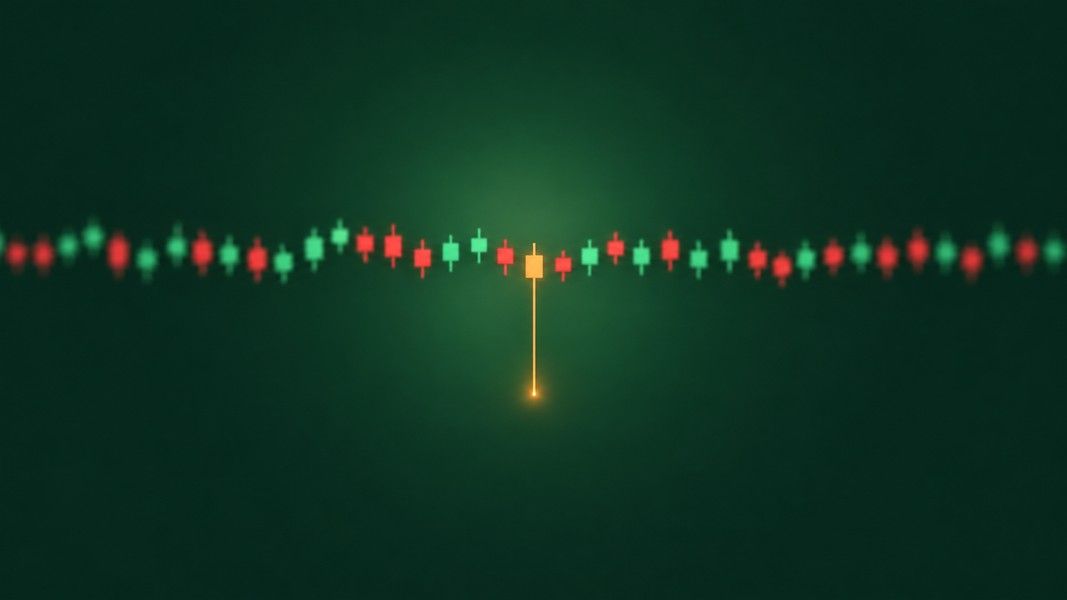
A long wick in the middle of a flat stretch, like the one below, is exactly the case the book leaves without a name.
Candlestick Patterns Built From Two Candles
An engulfing pattern is a small candle followed by a larger one whose body completely covers the first body and closes in the opposite direction. At the end of a decline, a green candle engulfing a red one is called bullish engulfing. At the end of a rise, a red candle engulfing a green one is called bearish engulfing.
Only the bodies count here. Per the StockCharts pattern dictionary, the second body has to cover the first open and close, not its whole range from high to low.
Picture it at the end of a decline. Day one is a small red candle whose upper wick spikes well above its body. Day two opens below that red close and finishes above the red open, while day one's wick still pokes out above the green body. That still counts as bullish engulfing. The wick is the part of day one's move that did not hold, and the pattern compares bodies, not extremes.
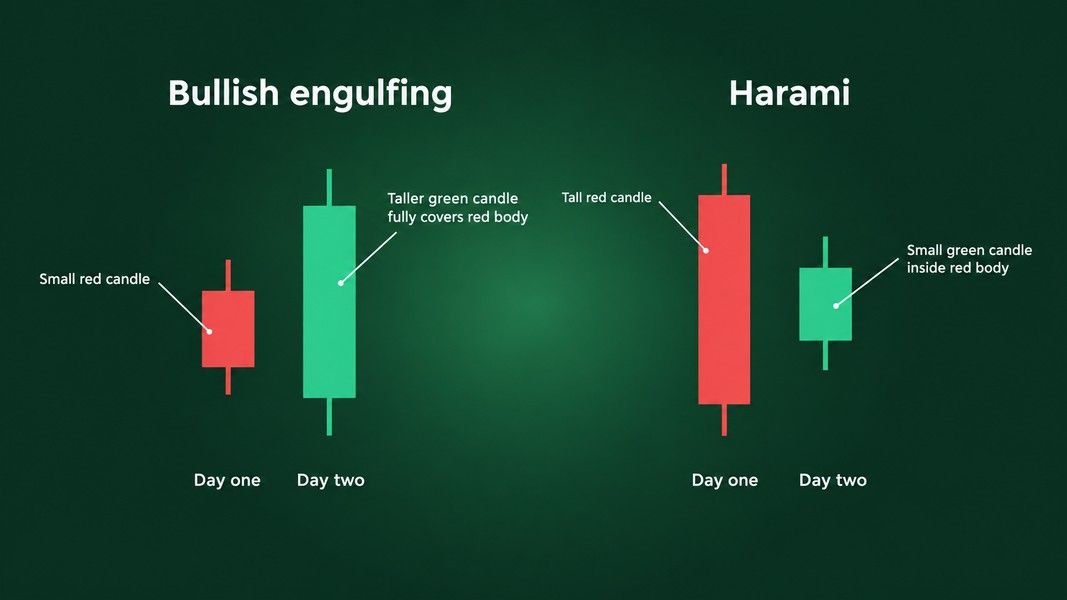
The harami lookalike
The lookalike runs the other way. In a harami, the same dictionary says, the small body comes second and sits completely inside the previous body. One candle swallows, the other gets swallowed, so mixing up the order turns one name into the other.
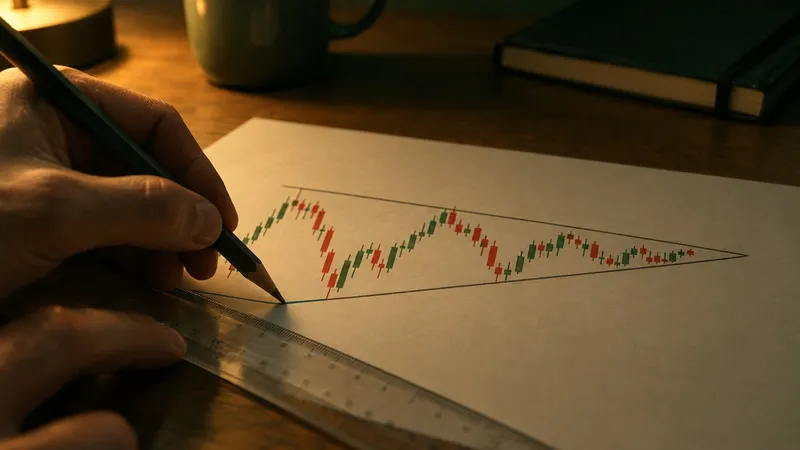
Shapes built across many candles, such as head and shoulders or triangles, are a different family. Our guide to bullish and bearish chart patterns covers them, and the chart patterns cheat sheet puts the common shapes on one page.
Where Candlesticks Came From
Candlesticks are usually traced to Munehisa Homma, a rice merchant from Sakata who traded on the Dojima rice exchange in Osaka in the eighteenth century and died in 1803. His birth year is given as 1716 in a Wiley book excerpt and as 1724 elsewhere.
The attribution is shakier than most guides admit. Steve Nison, who brought the charts to Western traders, wrote in his 1994 book Beyond Candlesticks that, based on his research, it is unlikely Homma used candle charts, as the Wikipedia history of the chart quotes him. He thought they more likely appeared in the early Meiji period, in the late 1800s. In Japan the chart is called ashi, meaning leg or foot.
Nison's 1991 book Japanese Candlestick Charting Techniques changed how the West drew charts. Until the late 1980s, real-time chart services in the US and Europe offered only bar charts. Within about two years of the book, almost every charting package offered candlesticks, according to the same Wiley excerpt.
What Candlesticks Do and Do Not Predict
Candlestick patterns are easy to name and hard to test, because a test needs a rule for when to get in and when to get out. Researchers have tried on several markets, and the results do not agree.
Tests that came up empty
- US large caps: Ben Marshall tested candlestick strategies on the stocks of the Dow Jones Industrial Average from 1992 to 2002 in his 2005 doctoral thesis, which shares its title with a 2006 Journal of Banking and Finance paper he wrote with Martin Young and Lawrence Rose. He found no evidence that a trader following them would do better than the market. In a 2007 paper, the three concluded that basing trading decisions solely on these techniques does not seem sensible, while leaving open that candlesticks could complement other methods.
- Tokyo: a 2008 study by Marshall, Young and Rochester Cahan in the Review of Quantitative Finance and Accounting found the same in the Japanese stock market from 1975 to 2004: no added value over the full 30 years, in any ten-year stretch, or in bull and bear markets, according to Young's seminar abstract.
- Intraday: Matthieu Duvinage, Paolo Mazza and Mikael Petitjean tested dozens of candlestick rules on five-minute data for the 30 Dow stocks, published in Quantitative Finance in 2013. About a third of the rules beat simply holding the stocks before trading costs, but once costs were counted, the authors found no evidence that any did better.
A test that found something
In Taiwan, Tsung-Hsun Lu, Yung-Ming Shiu and Tsung-Chi Liu found that three bullish two-day reversal patterns held up on the stocks of the Taiwan Top 50 Tracker Fund from 2002 to 2008, including in an out-of-sample test, in a 2012 paper in the Review of Financial Economics. Same kind of pattern, different market, different answer.
Why the studies disagree
One detail explains much of the disagreement. A 2015 study by Tsung-Hsun Lu, Yi-Chi Chen and Yu-Chin Hsu ran three-day reversal patterns on Dow stocks and found that eight of them passed or failed depending on the holding rule. With one exit rule they held up after a 0.5% trading cost and a correction for data snooping; with the exit rule Marshall, Young and Rose had used, they did not. The pattern alone did not decide the result; the exit did.
So here is the honest limit, plainly. A candlestick tells you what happened in a period, clearly and quickly. Whether a named pattern says anything reliable about the next period is still argued over, and the answer seems to depend on the market, the timeframe and the rules wrapped around it.
How to Practice Reading Candles
Reading candles is a habit more than a body of knowledge. These six steps are the habit.
- Say the four prices first. Before naming anything, read the candle out loud: opened here, went up to here, down to here, closed here.
- Look left. A hammer and a hanging man are the same shape. The trend before the candle gives it a name, and a flat stretch, like P&G's week, gives it none.
- Wait for the next candle. Most single-candle patterns are only treated as signals once later candles confirm them.
- Check the timeframe. As with the doji above, the same shape covers very different amounts of trading on different charts. Gregory Morris argued that intraday candles lack the overnight break that gives the open and close their weight, a point a 2015 working paper from Academia Sinica quotes.
- Ask why before asking what next. If the whole market lurched that day, as it did on May 6, 2010, the candle may be telling you about the market rather than the stock.
- Plan the exit before the entry. The research above suggests the exit rule shapes the result as much as the pattern does. Our guide to what a stop-loss is explains one common way traders set it.
A second opinion on a chart
If you want a second opinion on a chart you are looking at, Primo Trade can read it from a photo or a screenshot and give the AI's view of the trend and the chart pattern it sees. Like any reader of a chart image, it sees the shape, not the reason behind it. Our article on how AI reads a stock chart explains what that read can and cannot do.
Primo Trade gives AI-generated analysis for information and education. It is not financial advice. Markets carry risk; do your own research before you trade.
Conclusion
Every candle is four prices: open, high, low and close. The body shows how far the price moved between open and close, and the wicks show how far it went and came back. Named patterns like the doji, the hammer and the engulfing pattern are shorthand for those shapes, and each one depends on the trend before it and the candles after it.
P&G's candle on May 6, 2010 is the reminder to keep close. The shape was perfect, the story behind it was a market malfunction, and nothing about the candle could tell the two apart. Most tests on US and Japanese stocks found that trading on candlestick patterns alone did not hold up. One study of Dow stocks found that a set of three-day patterns passed under one exit rule and failed under another, so treat a pattern as one piece of evidence rather than an answer.