You put two lines on the same chart, both set to 200 days. One says the trend just turned up. The other is still sloping down and will not budge for another week. Same stock, same length, two different answers.
That is the whole exponential moving average vs SMA question in one picture. An exponential moving average (EMA) weights the latest closes more heavily, so it turns sooner. A simple moving average (SMA) weights every close in its window equally, so it turns later but finishes catching up sooner. Neither is the "right" line. Each one is wrong in its own predictable way, and knowing which way is the useful part.
This post covers how each line is built, the arithmetic of where its weight sits, a dated S&P 500 example from 2025 where the two disagreed by ten days, and which mistakes you sign up for with each.
EMA vs SMA: The Quick Verdict
If you only have a minute, this is the trade-off.
| Category | Simple moving average | Exponential moving average |
|---|---|---|
| Weighting | Every close in the window counts the same | The latest close counts most, older ones fade |
| Reacts to a fresh move | Later | Sooner |
| Fully reflects a new price level | After exactly N days | Never quite, about 87% after N days |
| Whipsaws in a sideways market | Fewer | More |
| Same value on every platform | Yes, if the data matches | Only with enough history behind it |
| Usual home | 50-day and 200-day trend lines | Short lines, and inside MACD |
The EMA buys you an earlier turn and pays for it with more false turns. Everything below is the detail behind that one sentence.
What a Simple Moving Average Is
A simple moving average adds up the last N closing prices and divides by N. A 5-day SMA of closes at 11, 12, 13, 14 and 15 is 13. The next day the oldest close drops out, the newest one comes in, and the average moves along the chart.
That is all there is to it, which is the SMA's main strength. Two traders with the same data and the same length get the same number, every time.
The drop-off effect
The weakness hides in the drop-off. A price from 199 sessions ago counts exactly as much as yesterday's in a 200-day SMA. Then on day 201 it vanishes completely. A big move from seven months back can make the SMA tick up or down today for no reason other than an old number leaving the window.
The 200-day and 50-day SMAs are the most watched trend lines on daily charts. The 50 and 200 together are what define the golden cross signals that financial news reports on.
What an Exponential Moving Average Is
An exponential moving average never drops anything out. Each day it moves a fixed share of the way from yesterday's EMA towards today's close. According to StockCharts ChartSchool, the calculation has three steps: start from an SMA as the first value, compute a multiplier, then repeat the update every day.
The exponential moving average formula
The multiplier is 2 divided by (N + 1). The daily update is:
EMA today = (close today minus EMA yesterday) × multiplier + EMA yesterday
For a 10-day EMA the multiplier is 2/11, or 18.18%, so each new close pulls the line 18.18% of the way towards it. A 20-day EMA uses 9.52%. ChartSchool points out that the weighting halves every time the period doubles, so a 200-day EMA moves only about 1% of the gap each day.
Why two platforms can show different EMAs
Because every EMA value depends on the one before it, the line carries a trace of every price since it started. ChartSchool notes that you need far more than 10 days of data for a stable 10-day EMA. Two charting platforms that load different amounts of history can show slightly different EMA values for the same stock on the same day. An SMA has no such problem.
Feature by Feature: Where the Two Lines Differ
The usual explanation stops at "the EMA weights recent prices more". The arithmetic says something more interesting, and it changes how you should read both lines.
Weighting: where the recent days sit
Run the multiplier forward and you can see how front-loaded an EMA is. Half of all the weight in a 20-day EMA sits on the last 7 sessions. For a 50-day EMA it is the last 17 sessions, and for a 200-day EMA the last 69.
A 20-day SMA puts only 35% of its weight on the last 7 sessions. Its weight is spread flat across all 20.
The flip side is the tail. About 13.5% of any N-day EMA's weight sits on prices older than N days. A 200-day EMA still remembers, faintly, what happened 250 or 300 sessions ago. The 200-day SMA has forgotten all of it.
Lag: the myth that the EMA is simply less late
Here is the part most explainers skip. Measure how old the data inside each line is on average, and the two come out identical. A 20-day SMA's closes are 9.5 sessions old on average. A 20-day EMA, with its multiplier of 2/21, also has an average age of 9.5 sessions. The same holds at every length: (N minus 1) divided by 2.
So the EMA is not less late overall. It is late in a different shape. It reacts faster to what just happened and slower to let go of what happened long ago. That is why "the EMA has less lag" is true at a turning point and misleading everywhere else.
Which line turns first, and which one finishes first
The cleanest way to see the difference is a single jump. Imagine a stock that trades flat, gaps to a new level overnight, and then stays at that new level. How much of the gap has each line covered after a while?
| Sessions after the jump | SMA has covered | EMA has covered |
|---|---|---|
| A quarter of N | 25% | 39% |
| Half of N | 50% | 63% |
| N | 100% | 87% |
| One and a half N | 100% | 95% |
These percentages are the same for any length, 10 days or 200. The EMA leads early, the lines cross over at some point before day N, and the SMA reaches the new level first.
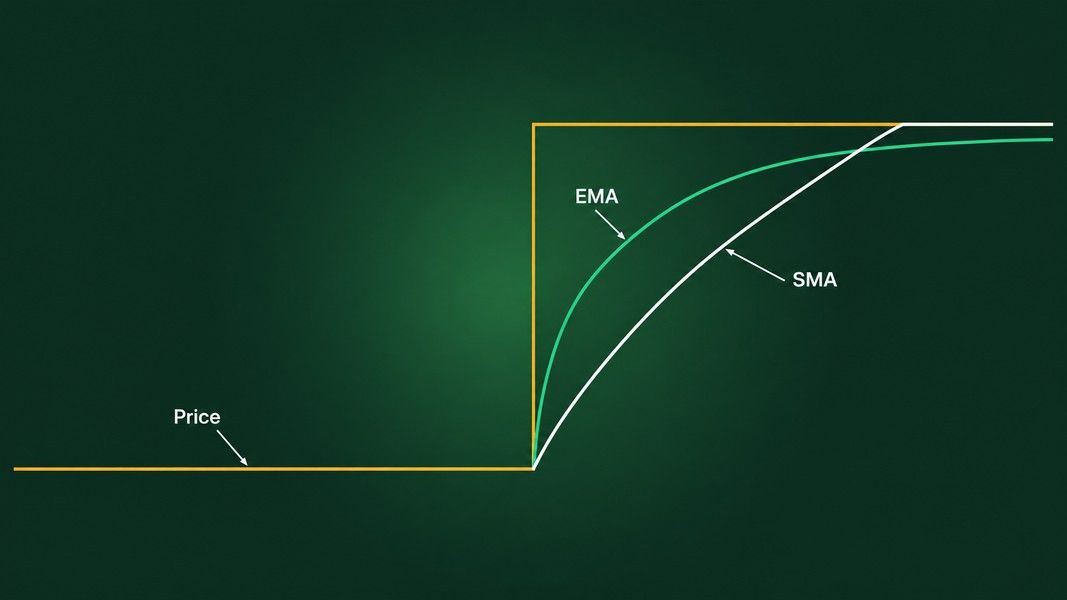
ChartSchool shows the same thing on a real chart: on its XLK example, the 50-day EMA turned up in early April while the 50-day SMA kept falling until the beginning of May, more than a month later.
Whipsaws and false crosses
The early turn has a cost. An EMA that follows the latest closes more closely also gets crossed more often when price chops sideways. Each of those crosses looks like the start of a trend for a session or two, then reverses. On a chart that is noise you have to ignore; in a rule that acts on every cross it is a string of small losses and fees.
A Dated Example: The S&P 500 and Its 200-Day Lines in 2025
Spring 2025 gives a clean case where the two 200-day lines disagreed. This is a read after the fact, not a view on the index today.
On 10 March 2025, the S&P 500 closed below its 200-day moving average for the first time since late 2023, as Reuters reported two days later. The tariff sell-off in April took it much further down. On 12 May, after the US and China agreed to cut tariffs, the index jumped back above the line and ended a run of 32 straight sessions below it, according to MarketWatch's William Watts. That is the 200-day SMA, the version the news quotes.
What the 200-day EMA did in the same weeks
One published test charted the 200-day EMA through the same window. The index got back above the EMA on 2 May at 5,687, ten days earlier than the SMA cross and 2.7% lower than the SMA's 5,844. It then fell back under the EMA on 6 May and crossed up again on 8 May. From January to July 2025, price crossed the SMA four times and the EMA six times.
That is the trade-off in one episode. The EMA flagged the recovery first, then produced a false exit and a second entry inside a week. The SMA said nothing until 12 May, then said it once.
What nobody could know on 2 May
On the day of the first EMA cross, there was no way to tell whether it was the start of a recovery or one more bounce in a falling market. Looking back, the 2 May cross was early and the 6 May exit was noise. On 2 May it was just a cross.
Which One Fits How You Trade?
The honest answer is the one whose mistakes you can live with. A few profiles help.
If you hold for weeks or months
A slow SMA, typically the 50-day or 200-day, fits a longer horizon. It produces fewer crosses, the value is identical on every platform, and it is the line most other people are watching. If the point of the line is to tell you which side of the long-term trend a stock is on, a calm line that moves rarely is a feature.
If you swing trade over days
Shorter EMAs suit swing traders who care about catching a turn a few days sooner. They will be wrong more often in a range, so they are usually read together with structure: swing highs and lows, the VWAP line for intraday context, and support and resistance levels.
If you trade within the day
On intraday charts both lines get noisy fast. A 50-period and a 200-period line crossing on a one-minute chart is not a golden cross or a death cross, whatever social media calls it. The same names mean different things on different timeframes.
Length matters more than type
The test cited above found that the difference between the best and worst length was far larger than the difference between an EMA and an SMA of the same length. On the S&P 500 since 1988, it found the EMA ahead at every length before trading costs, but after a cost of 0.25% per switch it stayed ahead only at 50 days, because the faster line switched more often. That is one trader's backtest on one index, a past sample and not a forecast, but the direction matches what the arithmetic above predicts.
Is There a Better Alternative?
Not in the sense of a third line that fixes both problems. Faster averages, such as Hull or zero-lag versions, cut the delay further and bring the same trade-off with them. Every smoothing method sits somewhere on the same line between responsive and calm.
What the research says about moving average rules
The bigger question is whether any moving average cross means much on its own. The classic 1992 study by Brock, Lakonishok and LeBaron found that simple moving average rules had predictive power on the Dow over 90 years of data. A 2015 study re-tested those rules on the Dow, the UK's FT30 and Japan's TOPIX from 1987 to 2013 and found that their predictive power had diminished in all three markets after 1986. The researchers found that markets had started reacting the day before a signal appeared, not on the day itself.
So a moving average works best as a description of where price has been, not as a trigger. It tells you the trend's direction and how far price has stretched from it.
Reading the chart in front of you
A moving average is one input among several on a chart: trend, volume, the pattern price is forming, and how volatile it has been. Primo Trade gives an AI analysis from a photo or screenshot of a chart, reading the trend, volatility, volume and the chart pattern it sees. It does not draw or compute a moving average of a length you pick.
For a ticker, Primo Trade pulls prices, news and financial metrics and gives a signal, a Primo Score of five 0 to 100 scores including a Technical one, and a Trading Strategy idea. That signal is the AI's read of the data, not an instruction, and a Technical score of 80 is not an 80% chance of anything. Primo Trade gives AI-generated analysis for information and education. It is not financial advice. Markets carry risk; do your own research before you trade.
The Bottom Line
The exponential moving average and the simple moving average are built from the same closes, and their data has the same average age. The difference is the shape of the weighting. The EMA leans on the last few sessions, so it turns first and gets fooled more often in a sideways market. The SMA spreads its weight evenly, so it turns later, reaches a new price level first, and gives fewer false crosses.
On the S&P 500 in spring 2025, that difference was ten days and two extra crosses. Pick the length that matches your horizon first, then the type whose mistakes you can tolerate, and read either line as a picture of the trend rather than a signal on its own.