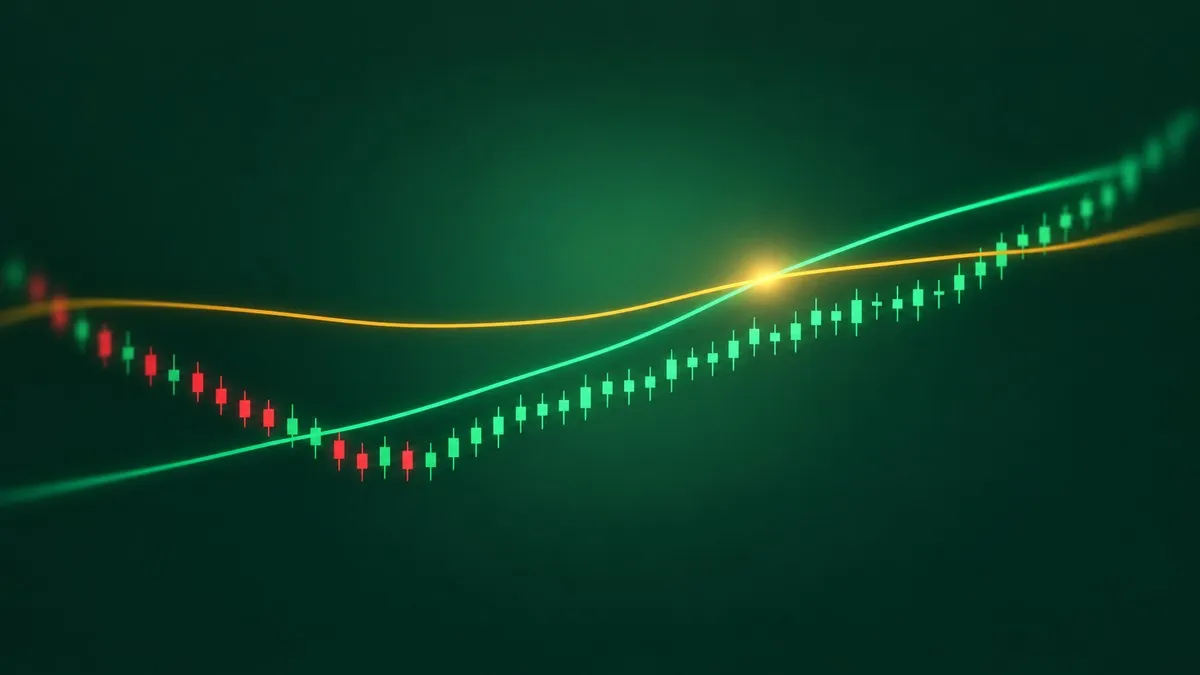
In July 2025 the S&P 500's 50-day average closed above its 200-day average, and within a week one headline said the move "signals something big ahead." A golden cross is exactly that event: a shorter moving average, usually the 50-day, crossing above a longer one, usually the 200-day. It is one of the most quoted signals in markets, and one of the few with seven decades of data behind it.
So the honest question is not what a golden cross means. It is what the index actually did afterwards, and whether that was any different from what it did after an ordinary Tuesday. The numbers below answer that, from three independent counts, and the answer is less dramatic than the headlines.
Golden cross statistics at a glance
Before the detail, the findings that hold across the sources:
- The S&P 500 had 38 golden crosses from 1950 to October 2026, roughly one every two years.
- Twelve months after a cross, the index was higher in 31 of 38 cases, 81.6%. Twelve months after any trading day, it was higher 74.4% of the time.
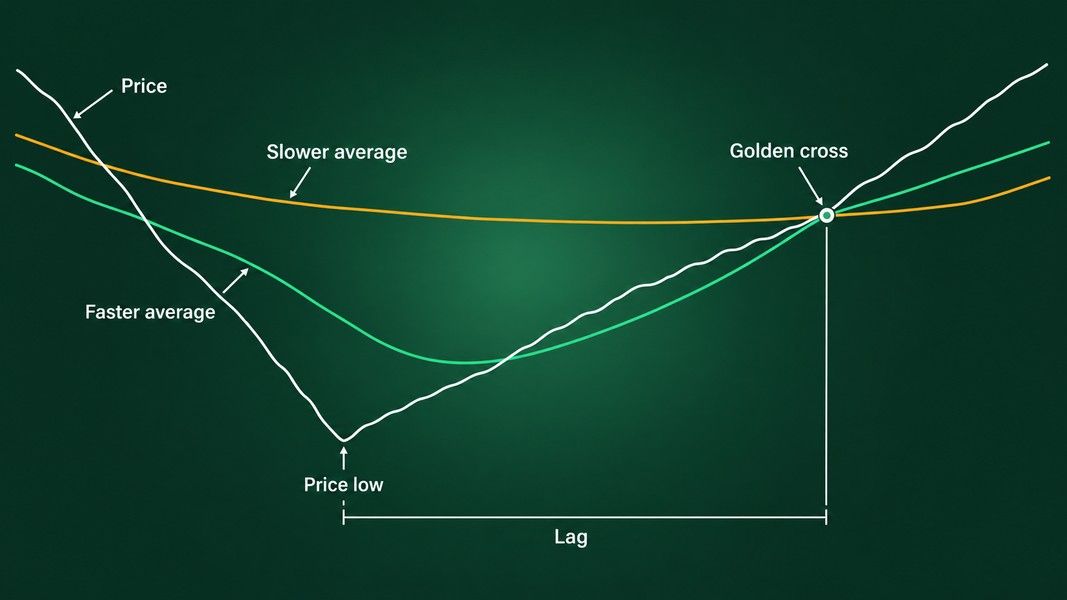
- The cross arrives late: in the median case about 61 trading days and 13.3% above the lowest close before it.
- On single stocks it is far weaker than on an index. In Thomas Bulkowski's sample of 475 stocks, the price at the next death cross was below the price at the golden cross 56% of the time.
- As a trading rule since 1950, it cut the worst drawdown from about 57% to 34%, and grew more slowly than simply holding the index.
The golden cross was ahead of an ordinary day on every horizon tested, but the lead is a few percentage points, not a different world.
What a golden cross is, and why it always arrives late
A moving average is the mean closing price over a set number of days, recalculated each day. The 50-day tracks roughly the last ten weeks; the 200-day tracks roughly the last ten months. When the 50-day rises above the 200-day, the recent price level has climbed above the longer one. That is all the signal states.
It is not a chart pattern in the shape sense, like the ones in our guide to bullish and bearish chart patterns. It is a trend filter. It looks only backwards, and it can only confirm a rise that has already happened. Every golden cross is, by construction, a report on the past few months.
The lag, measured on a real cross
The S&P 500 made a closing low of 3,577.03 on October 12, 2022. The golden cross came on February 2, 2023, with the index at 4,179.76. That is 77 trading days and 16.9% after the low, according to a recount of every S&P 500 cross since 1950 published by Kagels Trading in October 2026.
That cross was not unusual. Across all 38 signals, the median distance from the lowest close since the previous death cross was 61 trading days and 13.3%. Bulkowski found the same shape on a different sample: the lowest close in the six months before a cross came about three months earlier, and the market had already climbed between 12% and 26% in the median by the time the signal fired.
So if you wait for the cross, the first push off the bottom has usually happened without you. That is the price of a signal that cannot be early.
Simple or exponential averages
Most counts use simple moving averages, where every day in the window weighs the same. Exponential averages weight recent days more and cross a little sooner. In the Kagels count the EMA version also produced 38 crosses, and 12 months later the index was higher in 89.5% of them. As a full trading rule, though, it did marginally worse than the simple version. The practical point is to pick one definition and stay with it, because switching after the fact is how a backtest flatters itself.
The S&P 500 after 38 golden crosses, against any day
Most articles stop at the first column of this table. The second column is the one that matters, because the S&P 500 rose more often than it fell over most stretches of the last 76 years, signal or no signal.
| Window after the signal | After a golden cross (38) | After any trading day |
|---|---|---|
| 3 months, share higher | 76.3% | 66.7% |
| 6 months, share higher | 81.6% | 70.5% |
| 12 months, share higher | 81.6% | 74.4% |
| 12 months, median change | +13.1% | +10.5% |
| 12 months, worst case | −29.7% | −48.8% |
Sample: S&P 500 price index, daily closes, 50-day and 200-day simple moving averages, 1950 to October 2026, windows of 63, 126 and 252 trading days counted from the signal close. Only complete windows are included.
The signal comes out ahead in every row. The gap after six months is about 11 points, which is the clearest edge in the table. After a year it narrows to about 7 points. With only 38 events, a handful of different outcomes would move those percentages a lot.
Why the 80% headline needs its baseline
You will often see a version of this from Carson Investment Research, quoted by The Motley Fool in July 2025: since 1950 the index was higher a year after a golden cross about 80% of the time, with a median rise of 13%. That matches the count above.
What the headline leaves out is that a random day produced a higher index a year later about three times out of four as well. A statistic about a signal means little until you set it beside what happened without the signal. Once you do, the golden cross looks like a mild tilt on the index, not a starting gun.
The bad cases: seven of 38 were lower a year later
Averages hide the individual crosses, and some of them were rough. The worst in the Kagels count came on May 27, 1969: twelve months later the S&P 500 was 29.7% lower. The cross of April 1, 2019 was followed less than a year later by the Covid crash, and the index was 9.9% lower after twelve months. At the other end, the cross of December 21, 1953 was followed by a 41.8% rise.
No moving average could have told those three apart on the day they fired. They looked the same.
Whipsaws: when the cross reverses within months
A whipsaw is a signal followed quickly by the opposite signal, with no trend in between. In the S&P 500 count, 4 of the 38 golden crosses were reversed by a death cross within 63 trading days: December 1959, May 1969, January 1977 and December 2015.
They share a look on the chart. For months before the cross, both averages run almost flat and close together, so an ordinary bounce is enough to tip one over the other. When the 50-day and the 200-day are level and nearly touching, a cross between them says very little. A cross after a long, clear decline, with the 50-day turning up steeply, at least reflects a real change in direction.
Golden cross on a single stock versus an index
Almost all the famous numbers are about indexes. Bulkowski tested the signal on 475 individual stocks, 94 ETFs and 43 mutual funds beside the major indexes, and published the results on his pattern site. They split sharply.
His failure test is simple: buy at the golden cross, sell at the next death cross, and count how often the second price was lower than the first.
| Market | Failures (sold lower at the death cross) | Median months to the highest close |
|---|---|---|
| S&P 500 index | 24% | 10.7 |
| Nasdaq composite | 25% | 9.3 |
| Dow industrials | 44% | 6.5 |
| 94 ETFs | 53% | 5.0 |
| 475 stocks | 56% | 3.4 |
Sample: Bulkowski's own database of indexes, stocks, ETFs and mutual funds, 50-day and 200-day simple moving averages; the hold time runs from the cross to the highest close before the next death cross.
On the S&P 500, roughly three crosses in four ended above where they started. On individual stocks, more than half ended below. The rise after a stock's golden cross also topped out sooner, a median of 3.4 months against almost a year for the index. He also found that for half the markets he tested, the biggest rise of the move came before the buy signal, not after it.
If you take index statistics and apply them to a single ticker, you are borrowing a track record the stock never had.
Golden cross vs death cross: not mirror images
The death cross is the reverse event, the 50-day falling below the 200-day, and it is usually treated as the golden cross's evil twin. The data does not fully agree.
In the same S&P 500 count, the six months after a death cross were weak: the index was higher in only 55.3% of cases, against 70.5% for any day. After twelve months the difference had nearly gone, higher in 71.1% of cases against 74.4%. The lag cuts both ways. By the time a death cross prints, much of the fall has often happened, and after the death cross of March 30, 2020 the index was 50.7% higher one year later.
Earlier work tells a similar story with a twist. A study by CXO Advisory covering the S&P 500 from 1950 to May 2017 found the index higher 126 trading days later after 79% of its 34 golden crosses and 52% of its 34 death crosses, a clear difference. On the Dow from 1928 to 2017, with 58 crosses of each kind, the gap almost vanished: 60% after golden crosses and 55% after death crosses. Same signal, different index, different conclusion. That alone is a reason to hold any single statistic loosely.
The golden cross as a rule versus holding the index
The strongest case for the golden cross is not timing. It is risk. Kagels tested a simple model from October 1950 to October 2026: hold the S&P 500 while the 50-day is above the 200-day, step aside otherwise.
| October 1950 to October 2026 | Golden cross model | Buy and hold |
|---|---|---|
| Growth per year | 7.2% | 8.2% |
| Largest drawdown | −33.9% | −56.8% |
| Volatility per year | 11.8% | 15.8% |
| Time in the market | 72% | 100% |
The model sat out the worst of the big bear markets, which is why its deepest drop was about 34% instead of 57%. It also sat out many of the sharp rebounds that follow those markets, because it waited for the averages to cross back. One percentage point a year sounds small, but compounded over 76 years it roughly halved the final value. The model was ahead of buy and hold at only 12.7% of month-ends, and not once since September 2011.
The test is also a model: it leaves out the costs, taxes and slippage that each switch in and out would add. If the golden cross has a job, it is as a filter for when to be more careful, not as a source of extra growth.
Reading a golden cross on your own chart
When a cross shows up on a chart you are watching, a few questions separate the signals with something behind them from the noise:
- How far has price already come? Measure from the lowest close in the last six months. About 13% is the median for the S&P 500; a cross far above that means more of the move is already behind it.
- Were both averages flat and tangled before the cross? That is the whipsaw setup.
- Is this an index or a single stock? Index statistics do not transfer.
- Has the same pair crossed back and forth at a similar price before? Repeated crosses at one level mark a range, not a trend.
None of these turn the cross into a forecast. They only tell you how much weight a backward-looking signal deserves.
If you want a second read on a chart, Primo Trade's Analyze Chart takes a photo or screenshot and gives an AI read of the trend, volatility, volume and the chart pattern it sees, with a signal, a Primo Score and a short trading strategy idea. Like the golden cross, it reads what has already happened on the chart. Our piece on how AI reads a stock chart covers what a screenshot can and cannot show it, such as a missing timeframe or axis. Primo Trade gives AI-generated analysis for information and education. It is not financial advice. Markets carry risk; do your own research before you trade.
What seven decades of golden crosses add up to
The golden cross is a trend filter with a long, honest record on the S&P 500. After 38 signals since 1950, the index was higher a year later in 81.6% of cases, against 74.4% after any trading day. That is a real but modest lead, measured on a small sample.
It arrives about three months and a double-digit percentage after the low, so it confirms rallies rather than catching them. It whipsaws when the two averages are flat and close, and in Bulkowski's stock sample more than half of the crosses ended below their starting price by the next death cross. As a rule for holding the index, it cut the worst drawdown sharply and grew more slowly than staying invested.
Read it for what it is: a summary of the last few months of price, useful as context, and never a statement about the next few.