You open a five-minute chart at 10:15, and there it is: a smooth line sitting under the candles that was not there yesterday afternoon. That is the VWAP indicator, and it was not there yesterday because it did not exist yet. The VWAP indicator is the average price a stock has traded at since the session opened, weighted by how many shares changed hands at each price, and it starts again from zero every morning.
That one design choice, the daily reset, explains most of what VWAP is good at and most of where it misleads. This post walks through how the line is built, a worked example you can check with a calculator, how to read it, which settings change it, and the places where it quietly stops meaning anything.
What the VWAP Indicator Measures
VWAP stands for volume-weighted average price. A plain average treats every price the same. VWAP gives more weight to the prices where more shares traded, so a burst of heavy buying at one level pulls the line towards that level far harder than a quiet drift elsewhere.
Most charting platforms build it from candles rather than individual trades. The help page for the TradingView VWAP indicator lists the steps: take the typical price of each bar, which is the high plus the low plus the close divided by three, multiply it by that bar's volume, keep a running total of those products, and divide by the running total of volume.
Written as one line:
VWAP = cumulative (typical price × volume) ÷ cumulative volume
Two words in that formula do all the work. "Typical price" means one candle is boiled down to a single representative number. "Cumulative" means every bar since the start of the session stays in the sum. Nothing drops out of the window the way it does with a 20-bar moving average.
A Worked Example: Three Five-Minute Bars
Here is a made-up stock over the first fifteen minutes of a session. The numbers are invented to make the arithmetic easy to follow, not taken from any real chart.
| Bar | High, low, close | Typical price | Volume | Running VWAP |
|---|---|---|---|---|
| 9:30 | 50.40, 49.80, 50.10 | 50.10 | 30,000 | 50.10 |
| 9:35 | 50.70, 50.10, 50.40 | 50.40 | 10,000 | 50.18 |
| 9:40 | 50.90, 50.30, 50.60 | 50.60 | 10,000 | 50.26 |
After the second bar, the running total of typical price times volume is 1,503,000 plus 504,000, or 2,007,000, and the running volume is 40,000. Divide and you get 50.175, shown rounded. After the third bar it is 2,513,000 divided by 50,000, which is 50.26.
A plain average of the three typical prices would be about 50.37; VWAP sits lower at 50.26 because the busy opening bar counts three times as much as either quiet bar after it. That gap is the whole point of the indicator. It tells you where most of the day's shares actually changed hands, not where the candles happened to print.
Notice also that the stock closed the third bar at 50.60, above its VWAP. Everyone who bought during those fifteen minutes paid, on average, less than the current price. Hold on to that idea; it is the most honest way to read the line.
Why the VWAP Line Resets Every Morning
Standard VWAP is anchored to the session. When trading stops, the day's calculation ends, and at the next open a new one begins. The Charles Schwab guide puts it plainly: because the indicator is calculated for each day independently, it has no relation to past activity.
That reset has three consequences you can see on any chart.
The first bars of the day move the line a lot. With little volume in the total, each new bar is a big share of the sum, so VWAP can swing early and then settle as the session fills in. By mid-afternoon, one bar barely nudges it.
A session VWAP on a daily chart is close to useless. TradingView's documentation says that for VWAP to work properly, each period should contain several bars, so setting the anchor to the session on a one-day chart is not useful because the line resets on every bar. Its settings even include an option to hide VWAP on daily and higher timeframes for exactly this reason.
Trading outside the regular session raises a question you have to answer for your own chart. If you also follow after-hours trading, check whether the bars your platform shows before the open and after the close are feeding the line, because thin extended-hours volume changes where the session's average starts.
VWAP vs a Moving Average
At a glance VWAP looks like a moving average, and TradingView describes it in similar terms: when price is above VWAP prices are rising, when price is below VWAP they are falling. The two lines are built very differently, though.
A moving average looks back a fixed number of bars and forgets everything older. VWAP looks back to the start of the session and forgets nothing until the reset. A 20-bar average on a five-minute chart only knows the last 100 minutes; VWAP at 3 p.m. still carries the opening rush.
A simple moving average also gives every bar the same weight. VWAP lets volume decide, so a quiet lunch hour hardly moves it while a news-driven spike can drag it a long way.
Both lag. Schwab notes that because VWAP is an average, it trails the current price. That is not a flaw to fix with settings; it is what any average built from past data does.
How to Read the VWAP Indicator on an Intraday Chart
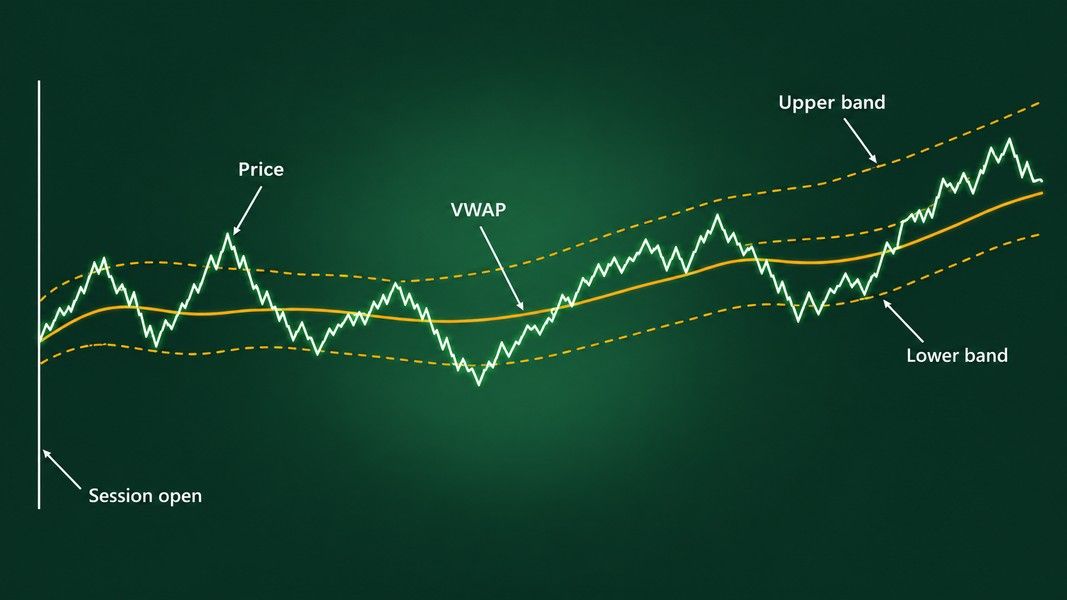
The simplest reading is position. TradingView's help page frames it this way: prices holding above VWAP describe a bullish intraday trend, prices holding below it a bearish one, and prices crossing back and forth describe a sideways market.
The worked example gives the more useful version. Price above VWAP means the average buyer today is ahead; price below it means the average buyer is behind. That is a statement about the day's traders, not a forecast about the next bar.
What the VWAP bands add
Many platforms draw bands above and below the line at a set number of standard deviations from VWAP. Schwab's guide says the upper band might be considered an overbought level and the lower band an oversold one. The words "might be considered" are doing honest work there: a band is a measure of how far price has stretched from the day's average, not a wall it has to bounce off.
When the bands are narrow, the day's trading has stayed close to its average. When they widen, price has been spreading out. That makes them a quick read on how calm or jumpy the session has been.
What crossings look like in a range
On a day with no direction, price weaves through VWAP again and again. Each cross looks like a signal and most of them are noise. If you count four or five crosses before lunch, the line is telling you the session has no trend, which is information in itself.
How Institutions Use VWAP, and Why That Matters to You
VWAP started as a yardstick, not a chart signal. A fund buying a large position over a whole day cannot buy it all at one price, so it measures the trader who executes the order against the day's VWAP: buy below it and the execution was cheap relative to the market, buy above it and it was expensive.
This use is large. A study by Jędrzej Białkowski, Serge Darolles and Gaëlle Le Fol, published in 2008 in the Journal of Banking & Finance and tested on the stocks in France's CAC 40 index, states that VWAP execution orders represent around 50% of institutional investors' trading. Their paper is about forecasting intraday volume so those orders track the end-of-day VWAP more closely.
Two things follow for a chart reader. Big orders working towards the day's average may be one reason price can spend time near the line. And the fact that institutions measure themselves against VWAP does not show that a retail trader crossing it has any edge. A benchmark for execution and a signal for entry are different jobs.
VWAP Indicator Settings Worth Checking
Two traders can look at the same stock at the same minute and see different VWAP values, and usually the settings explain it. These are the ones to look at before trusting the number:
- Source. TradingView's anchored version uses hlc3, the typical price, by default, with hl2, the midpoint of high and low, as another common choice. A different source moves the line.
- Anchor period. Session is the classic setting. Week, month and longer anchors turn VWAP into a much slower line with a different meaning.
- Bands. How many standard deviations each band sits from the line, and how many bands are drawn at all.
- Timeframe. The line is only meaningful when each anchor period holds many bars, so a session VWAP belongs on minute and hour charts.
None of these settings is right or wrong. They just have to be the same when you compare a chart with someone else's, or with your own from last week.
Anchored VWAP: Starting the Clock Somewhere Else
An anchored VWAP keeps the same formula but starts the running totals at a point you choose instead of the session open. The VWAP Auto Anchored indicator on TradingView lists the options: the start of a session, week, month, quarter or year, the bar with the highest high, lowest low or highest volume in a lookback window, and the bar of the last earnings report, dividend or split.
Anchoring to an earnings release, for example, gives you the volume-weighted average price everyone has paid since the news. Price above that line means the average post-earnings buyer is ahead; below it, behind.
The catch is choice. An anchor picked after you have seen what price did will almost always look meaningful. Decide where the line starts before you look at what happened next, or the line will simply agree with you.
Where the VWAP Indicator Misleads
VWAP is calm and tidy, which makes it easy to over-trust. A few honest limits:
It lags by design. Everything in the line is in the past. It describes where the day's volume traded, never where the next trade will be.
The opening stretch is unstable. With so little volume in the total, the first part of the session can push VWAP around, and crosses in that stretch carry little weight.
It is not fair value. VWAP is the average price traders accepted today. It says nothing about earnings, cash flow or what the business is worth.
It does not draw levels that price must respect. Traders talk about VWAP as dynamic support and resistance, and price does sometimes pause at it, but the same habits of thought apply as to any line on a chart. The myths about support and resistance apply to a moving line just as much as to a flat one.
Reading VWAP Beside a Chart Photo
If you take a photo or screenshot of an intraday chart and send it to Primo Trade's Analyze Chart, the AI reads what is in the picture: the trend, volatility, volume and sentiment, the chart pattern it sees and what that pattern usually signals. The result shows a signal as its read of the chart, a Primo Score, a Trading Strategy idea and Key Insights. It does not calculate VWAP for you, and it cannot know what source, anchor or band settings produced a line drawn on someone's screen.
Primo Trade gives AI-generated analysis for information and education. It is not financial advice. Markets carry risk; do your own research before you trade.
Read that way, the AI analysis is a second opinion beside your own look at the VWAP line, not a replacement for checking the settings above. Primo Trade is free to download for iOS and Android, with free analyses to start.
The Bottom Line
The VWAP indicator is a running, volume-weighted average of every trade since the open, and the daily reset is what defines it. Read it as a description of the day's traders: above the line, the average buyer today is ahead; below it, behind.
It started as an institutional execution benchmark, and that use is large, but a benchmark is not a trading edge. The line lags, it is jumpy early in the session, it means little on a daily chart with a session anchor, and it changes with source and anchor settings. Anchored VWAP is a useful variation as long as the anchor is chosen before the outcome is known.