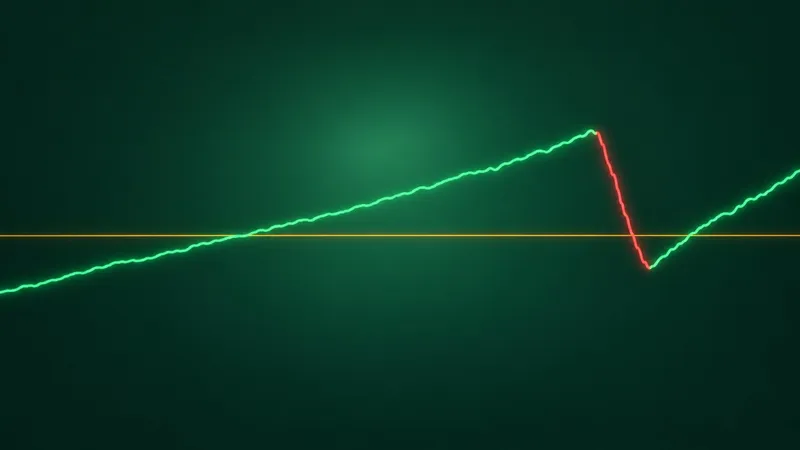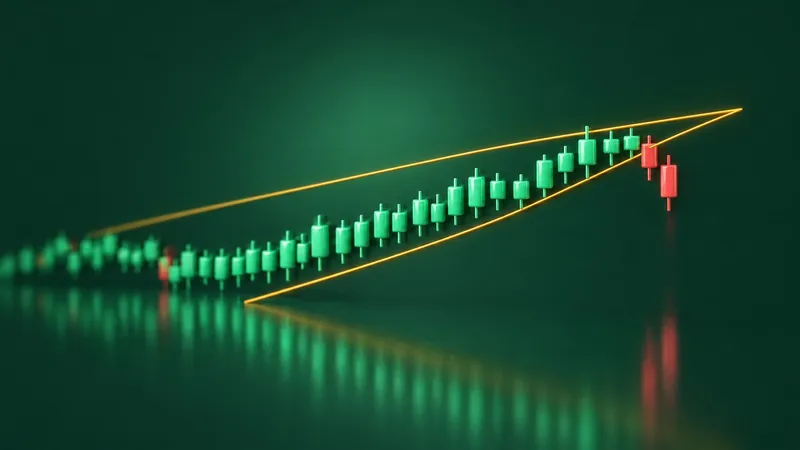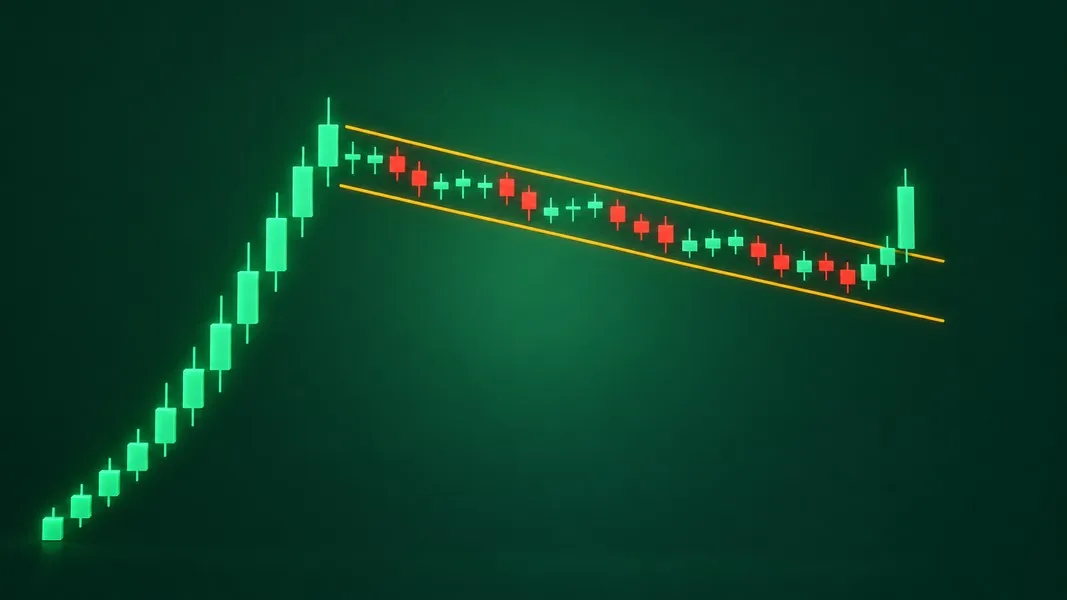
A stock rips higher for four straight days, then spends the next week drifting lower in a neat little channel. Someone on a forum calls it a bull flag. Turn the chart upside down and the same picture is a bear flag. Both names describe one idea: a sharp move, a short pause, and a bet on which way the pause ends.
The quick verdict on bull flag vs bear flag: a bull flag is a short pause that drifts down or sideways after a sharp rise, and a bear flag is a short pause that drifts up or sideways after a sharp fall. Volume, timing and confirmation follow the same rules in the mirror. What separates a useful flag from a dead one is not its direction. It is the pole, the tightness of the pause, and a close through the far line.
This comparison covers how each one forms, where they differ side by side, what Thomas Bulkowski's statistics say about how often flags fail, and the lookalikes that borrow the name.
Bull flag vs bear flag at a glance
| Bull flag | Bear flag | |
|---|---|---|
| Comes after | A steep, fast rise | A steep, fast fall |
| The flag drifts | Down or sideways | Up or sideways |
| Volume inside the flag | Usually fades | Usually fades |
| Confirms on | A close above the upper line | A close below the lower line |
| Measured target | Pole height projected up | Pole height projected down |
| Failed to move 5% (Bulkowski) | 44% of upward breaks | 45% of downward breaks |
The last row is the one most guides skip. In Bulkowski's sample, close to half of all flags never travelled even 5% past the breakout before turning around, whichever way they broke. The shape is common. A flag that follows through is much less so.
What a bull flag pattern is
A bull flag pattern forms in two parts. First comes the flagpole: a fast, near-vertical rise over several days, the kind of move that punches through an old resistance level on heavy volume. Then comes the flag, a small block of candles that drifts down or sideways between two parallel lines.
StockCharts' ChartSchool describes flags as short-term continuation patterns that mark a small consolidation before the previous move resumes. It treats the pole as part of the definition, not decoration: without a sharp advance or decline before it, the formation's reliability becomes questionable.
The story the chart tells is simple. Buyers pushed hard, some of the early ones sold into the rise, and nobody new was in a hurry to chase. The price leans back without giving up much ground. A close above the flag's upper line says the buyers are back and the earlier move has resumed.
So what is a bull flag, in one line? A pause that keeps most of a sharp rise, read as bullish only after the price closes above it.
What a bear flag is
A bear flag is the same structure upside down. A steep drop forms the pole, often with gaps and heavy volume. Then the price drifts up or sideways in a small, tight channel, and the bounce feels like recovery while it is happening.
The pattern reads that bounce the other way. Sellers paused, some short sellers bought back, and buyers did not arrive with enough force to push far. A close below the flag's lower line says the decline has resumed.
Bear flags are harder to sit through, because the flag looks like hope. A rising flag after a crash is not a recovery until it does something a flag does not do, such as climbing well into the pole or running on for weeks. Until then it is a pause with a question mark.
If you want both shapes beside their relatives, our guide to bullish and bearish chart patterns sorts the common ones by what they usually signal and what they do not.
How the two patterns differ, part by part
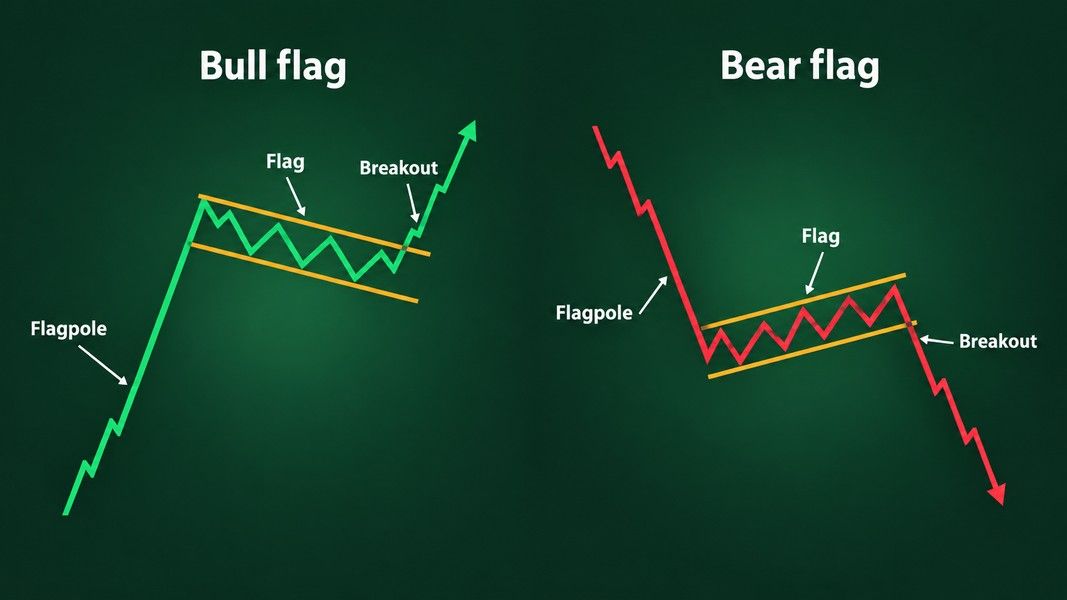
Side by side, the two flags are mirror images. The useful differences sit in the details: which way the flag leans, what volume does, how long it lasts, and where it confirms.
The pole and the slope
ChartSchool says a flag slopes against the trend before it. After a rise, the flag tilts down; after a fall, it tilts up. Bulkowski's description is looser on direction and stricter on the pole. On his page of flag statistics he lets the price trend lead into the pattern from any direction, but says the flagpole should be unusually steep and last several days. In his words, if you don't have a straight-line price run, then you don't have a flag.
He also found that the best performance came from an upward trend into a flag that tilts downward. That is the textbook bull flag, and it is the one case where the slope is more than cosmetic.
Volume inside the flag
Both sources agree the pole should come on heavy volume. Inside the flag, quiet is normal. Bulkowski found volume trending downward in 74% of flags that broke upward and 77% of flags that broke downward.
ChartSchool adds the other half: an expansion of volume on the break lends credence to the pattern. A fading flag followed by a loud break is the shape both sources describe, in either direction.
How long a flag lasts
Here the sources disagree, and the disagreement is worth knowing. ChartSchool gives flags and pennants one to 12 weeks, and calls the reliability of anything between eight and 12 weeks debatable. Bulkowski draws the line much shorter: flags are less than three weeks long, and patterns longer than that are rectangles or channels.
The practical reading is the same either way. The longer the pause runs, the less it behaves like a flag, and the more it becomes a different pattern with different statistics.
The break and the target
A flag confirms on a close through the far line: above the upper line for a bull flag, below the lower line for a bear flag. The classic target takes the pole's height and projects it from the break.
An older worked example in ChartSchool, on HPQ, shows the textbook version. The stock broke resistance at $28 and ran to $38 in four weeks, which formed the pole. The flag drifted down for 23 days and broke out at $36. The first push above the upper line came without extra volume; a week later the stock gapped up and closed strong on above-average volume. Adding the 10-point pole to the $36 breakout projected $46.
Bulkowski trims that projection. He multiplies the height of the price swing into the flag by 46%, the share of his flags that reached the full target in either direction, and projects that smaller figure instead.
How often flags fail in Bulkowski's numbers
Bulkowski uses a strict and simple test. In his failure ranks, a chart pattern fails if price does not move more than 5% away from the breakout price before reversing. A 5% move is not much. Plenty of flags still came up short.
His bull market results for flags, based on hundreds of perfect trades, read like this. 44% of upward breakouts and 45% of downward breakouts failed by that 5% test. The average move after the break was a 9% rise for upward breakouts and an 8% decline for downward ones. Only 46% in each direction reached the full measured target.
Two details make those numbers more honest than most. Flag results are measured on the short-term price swing, not to the ultimate high or low, which is why he does not rank flags against other patterns and why the averages look small. And "perfect trades" means entering at the breakout and exiting at the best price that followed, which nobody does in practice. These are measured averages of a past sample, not a result a reader can expect.
One more figure deserves a pause. Across all his flags, the breakout went upward 60% of the time. The name you give a flag before it breaks is a guess, and the break is what settles it.
What the better flags had in common
Bulkowski's trading tips point to a few traits that showed up among the better performers:
- Tight, not loose. A loose flag is one where the price meanders, pokes outside the trendlines, leaves white space or looks jagged. Tight flags performed better.
- A flat base underneath. A flag sitting above a flat base, for upward breaks, or below one, for downward breaks, tended to see a larger move.
- Near the yearly low. The best performers broke out within a third of the yearly low, not near the highs where most people go looking for flags.
- A pole that came out of nowhere. The steep, several-day run is what turns a sideways drift into a flag in the first place.
Lookalikes that borrow the name
Most flags that disappoint were never flags. Four shapes get the label by mistake.
An ordinary pullback
A stock that rises steadily for a month and then dips for a few days has a pullback, not a flag. There is no pole, only a trend taking a breath. By Bulkowski's own guideline, no straight-line run means no flag, and the flag statistics above say nothing about it.
A rectangle or a channel
A pause that keeps going past three weeks has, by Bulkowski's definition, become a rectangle or a channel. ChartSchool is more generous on time, but treats the eight to 12 week range as doubtful. Either way, a "flag" that has been drifting for two months is a different pattern under a borrowed name.
The high and tight flag
The high and tight flag is a rare cousin with its own rules and its own numbers. Bulkowski's page on the high and tight flag requires the price to rise at least 90% in two months or less, and says the pause that follows often does not look like a flag at all.
Its numbers look very different from ordinary flags: a break-even failure rate of 15%, an average rise of 39% and 82% meeting a half-height target, across 1,028 perfect trades. The catch is in the confirmation. Bulkowski only counts the pattern as valid on a close above the highest peak, which is usually the top of the flagpole, and writes that new research found high and tight flags fail too often when traded on a flag trendline break.
A flag that breaks the wrong way
Some flags simply resolve against their name. A bull flag closes below its lower line; a bear flag closes above its upper one. With 60% of Bulkowski's flags breaking upward, a flag after a fall breaking up is not a rare event.
The far side of the flag is where the pattern's story stops being true, which makes it the natural line to watch. Our guide to what a stop-loss is covers how stop orders behave at a line like that, including what happens when a stock gaps straight through one overnight.
Reading a flag from a chart photo
Knowing the rules is the easy part. The hard part is the flag that is still forming: is that drift a tight flag or a loose one, and is the pole steep enough to count? A second read helps most at exactly that point.
Primo Trade reads a photo or screenshot of a chart and gives the AI's view of the trend, volatility, volume and sentiment it sees, the chart pattern it recognises, and what that pattern usually signals. The result also carries a signal, a Primo Score and a Trading Strategy idea with a risk level. If it reads a US ticker on the image, the full ticker analysis runs, with recent news and the model's 6 to 12 month estimate.
Primo Trade gives AI-generated analysis for information and education. It is not financial advice. Markets carry risk; do your own research before you trade.
Treat that read the way you would treat Bulkowski's tables, as a description of what is on the chart now. An AI can name a pole and a channel; whether the close through the far line ever comes is something the chart has not decided yet. Our chart patterns cheat sheet draws the flag beside the pennant, the double bottom and the head and shoulders, with what confirms each one.
The short version
A bull flag is a steep rise followed by a short, tight drift down or sideways, read as bullish once the price closes above the flag. A bear flag is the mirror: a steep fall, a short drift up or sideways, read as bearish once the price closes below it. Volume usually fades inside both, and a loud break is what the sources look for.
The numbers keep the pattern in proportion. In Bulkowski's sample, close to half of flags in either direction failed to move even 5% past the break, fewer than half reached the full target, and 60% broke upward regardless of how they looked beforehand. A steep pole, a tight flag under three weeks old, and a close through the far line are what separate a flag from a pause that only looks like one.