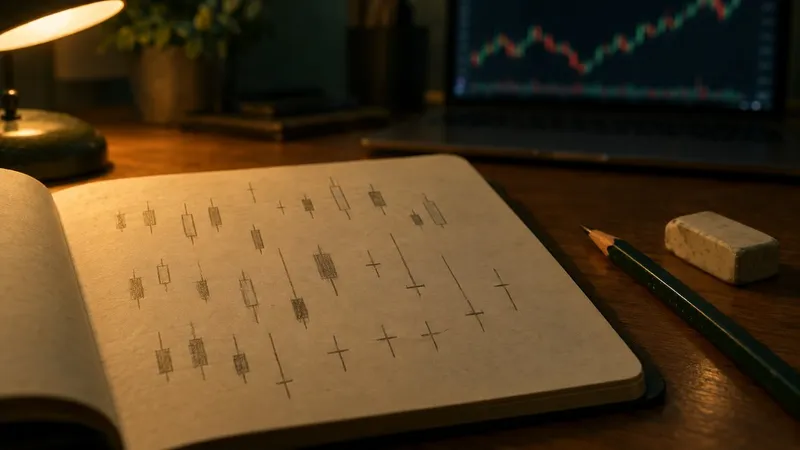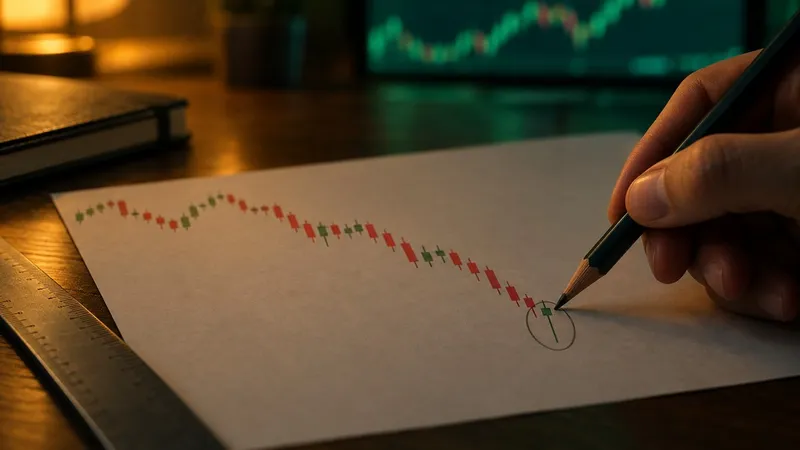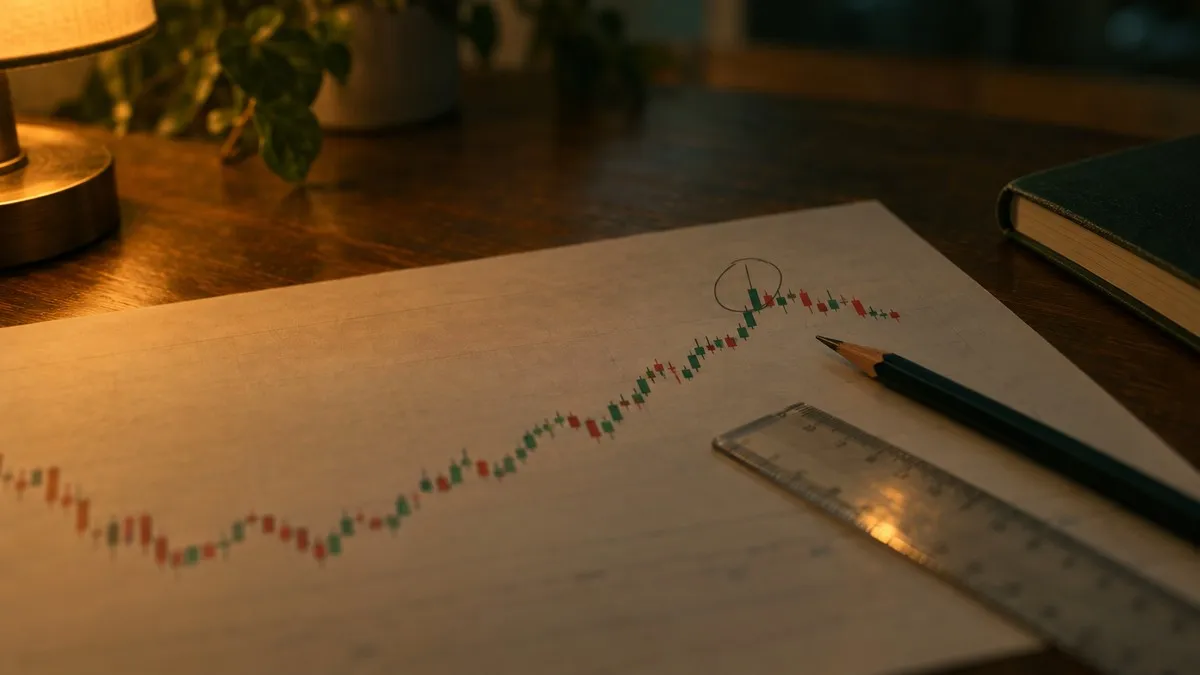
A stock has climbed for a week. One morning it opens above yesterday's close, runs hard in the first hour, then gives nearly all of it back and settles near where it opened. On the daily chart that session leaves a small body with a tall wick sticking up out of the top, and someone in the chat calls it before the bell: shooting star.
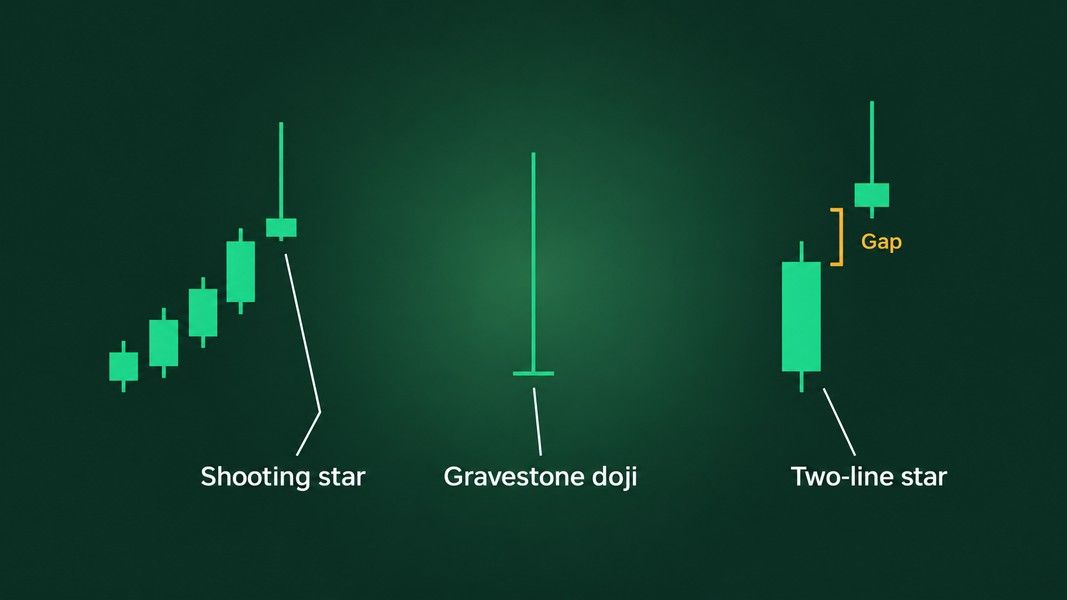
A shooting star candlestick is a single candle that forms after a rise, with a small body near the low of its range, a tall upper shadow at least twice the height of the body, and little or no lower shadow. It records buyers pushing the price well up and sellers pushing it back down before the close. In Thomas Bulkowski's testing it went on to reverse the uptrend 59% of the time.
The surprise sits one step further in. Bulkowski also tested the version many websites describe, a white candle followed by a star that gaps above it, and that one did the opposite: the uptrend carried on 61% of the time. This guide covers what the candle records, how often it turns, why the gap changes the reading, and where the better shooting stars tend to show up.
What a shooting star candlestick records
Every candle carries four prices: open, high, low and close. The body spans the open and the close, and the shadows, or wicks, reach out to the high and the low. If that anatomy is new, the candlestick chart basics walk through it first.
In a shooting star, the upper shadow does the talking. StockCharts' candlestick pattern dictionary describes a session that opens higher, trades much higher, and then closes near its open. It adds that the candle looks just like the inverted hammer, except that it is bearish.
Bulkowski's identification guidelines ask for three things: an upward price trend leading into the candle, a small body that is not a doji, and a tall upper shadow at least twice the height of the body with little or no lower one. His guidelines say nothing about the colour of the body.
What the shape shows is a session where the push higher failed to hold. The candle is a record of that failed push, not a forecast of the next session. Keeping those two apart is what the rest of this guide is about.
How often the shooting star pattern reverses
Bulkowski tested 103 candlestick patterns on daily charts for his Encyclopedia of Candlestick Charts. On his shooting star page the one-candle version acts as a bearish reversal 59% of the time. He calls that "near random" performance, and his advice is plain: although price reverses more often than not, do not depend on it.
He counts a reversal only when price closes below the bottom of the candle. With the close already near the low, he notes, it should not take much for that to happen, and yet it does so only 59% of the time.
The size of the move after the break is modest too. Out of 103 patterns, where 1 is the pattern followed by the biggest moves, the shooting star ranks 55. The best average move in the ten days after a breakout, across bull and bear markets and both breakout directions, was 3.86%, and it came after an upward breakout in a bear market, which is the direction the candle is supposed to argue against. Bulkowski considers 6% or more a good move and concludes that the candle looks better than it performs.
These are frequencies measured on a past sample, not odds for the next shooting star on your screen. By the same testing, roughly four times in ten the price did not break down after a textbook single-candle star.
When the gap flips the signal
Some descriptions of the shooting star use two candles: a tall white candle in an uptrend, then a small-bodied star that gaps above it with a long upper shadow. Bulkowski found both versions described on websites, so he tested them separately, and the results point in opposite directions.
His two-line version needs a white first candle, a gap between the two bodies, and a second candle of any colour whose upper shadow is at least three times the height of its body. That pattern acted as a bullish continuation 61% of the time, not as a reversal.
His reading of it is that the gap shows momentum, the tall shadow shows the bulls failing to hold the high, and in practice the pause turns out to be a momentary glitch on the way to a new high. In his sample, the extra candle and the gap turned a weak bearish signal into a weak bullish one. Its overall rank is 52 of 103, and its best ten-day move was a decline of 4.93%, after a downward breakout in a bear market.
Both versions side by side, with the doji
| Pattern, as Bulkowski tested it | Candles | Tested behaviour | Overall rank of 103 |
|---|---|---|---|
| Shooting star | One | Bearish reversal 59% of the time | 55 |
| Two-line shooting star, with a gap | Two | Bullish continuation 61% of the time | 52 |
| Gravestone doji | One | Bearish reversal 51% of the time | 77 |
Bulkowski adds one more clue for the gapped version: when it sits within a third of the yearly high, it acts as a continuation pattern most often. So the star that looks most dramatic, a gap up near the yearly high, is the setup where his testing saw the trend carry on most often.
Shooting star vs inverted hammer and gravestone doji
Three candles share the same silhouette, and the context decides which one you are looking at.
The inverted hammer has exactly the shape of a shooting star: small body low in the range, long upper wick, little lower wick. The only difference is the trend before it. After a decline it is an inverted hammer; after a rise it is a shooting star. The hammer myths guide covers how the inverted hammer behaved in testing.
The gravestone doji has the same long upper shadow, but its open and close are within pennies of each other, so there is no real body at all. Bulkowski's guidelines for it require no particular trend beforehand. In his testing it acted as a bearish reversal 51% of the time, which he calls random, and its performance rank of 77 of 103 puts it near the bottom of the list.
When Primo Trade's AI reads a photo of a chart, it names the chart pattern it sees and what that pattern usually signals. That makes the lookalike problem a good test of any reader, human or AI: the name of the candle depends on the bars before it, so a screenshot that shows only the last few candles leaves out the context the name depends on.
Where the shooting star candlestick tends to work better
The usual description places the shooting star at the end of an uptrend. Bulkowski's tidbits from his book point somewhere less obvious.
For the single-candle star he lists three: shooting stars within a third of the yearly low perform best, the best ones appear as part of an upward retracement inside a downward price trend, and stars within a third of the yearly low frequently act as reversals. In other words, the strongest shooting stars in his sample were a bounce that failed inside a falling stock, not the peak of a rising one.
That fits a broader result in his candlestick tip on yearly ranges. Among the candles that showed the highest move after their breakout, 84% began in the lowest third of the yearly price range, 11% in the middle third and 5% in the highest third.
It also fits his general rule of thumb for candles: trade bearish candles in a primary downtrend. A shooting star that agrees with the bigger trend has the current on its side. One that argues against a strong uptrend is swimming upstream.
What wider research says about candlestick signals
Bulkowski's numbers measure how often a pattern did what its name says. Academic studies ask a harder question: did trading on the signals add anything over simply holding the stock?
Ben Marshall, Martin Young and Lawrence Rose tested candlestick rules on thirty-five US stocks in a paper published in the Journal of Banking and Finance. Their conclusion was blunt: the results consistently show that candlestick technical analysis has no value, and neither bullish nor bearish signals consistently outperformed a buy-and-hold approach.
A 2017 study of the Stock Exchange of Thailand, which included black and white shooting stars in its list of bearish one-day patterns, found the average moves after most patterns were not statistically different from zero. Its literature review notes that earlier studies had found candlesticks of little use in the US and Japanese markets.
None of this says the candle is meaningless. It says the shape alone, applied mechanically to every occurrence, does not carry much information. That is consistent with Bulkowski's "near random" 59%.
How to read a shooting star in practice
The candle is a prompt to look harder, not an answer. Before giving one any weight, it helps to run through the same questions the testing raises:
- Was there a rise before it? After a decline the same shape is an inverted hammer.
- Is there a real body under an upper shadow at least twice its height? With the open and close within pennies of each other it is a gravestone doji, and a short wick on a mid-sized body is just an ordinary candle.
- Did it gap above a white candle? If so, Bulkowski's two-line numbers apply, and those leaned toward continuation.
- Where is it in the yearly range? Near the yearly low and inside a downtrend is where his better results sat; near the yearly high is where the gapped version continued most often.
- Did the next close break the candle's low? Until it does, Bulkowski does not count a reversal at all.
What to watch after the star
Investopedia's write-up adds that traders who act on a shooting star keep watching for signs the move down is ending, such as a hammer, a bullish engulfing pattern, a morning star or bullish divergence on the RSI. The candlestick patterns cheat sheet puts those shapes on one page.
A second read helps when you are unsure what you are looking at. Primo Trade can take a photo or screenshot of a chart and return the AI's read of trend, volatility, volume and sentiment, the pattern it sees, a signal from Strong Buy to Strong Sell, and a Primo Score. Primo Trade gives AI-generated analysis for information and education. It is not financial advice. Markets carry risk; do your own research before you trade.
The shooting star, in short
A shooting star records a session where the price was pushed well up and fell back by the close. In Bulkowski's testing the single-candle version reversed an uptrend 59% of the time, which he calls near random, and the moves that followed were modest.
The gapped two-candle version, the one many websites describe, did the opposite and continued higher 61% of the time. The gravestone doji, its bodiless lookalike, reversed only 51% of the time. Academic tests on US stocks found no value in trading candlestick signals mechanically.
What the testing does reward is context: a star inside a downtrend, near the yearly low, confirmed by a close below its low. The wick tells you a push failed. The bars around it tell you whether that failure mattered.