
In 2021 Amazon reported net income of $33.4 billion. In the same year, by its own count, it had negative free cash flow of $9.1 billion. Both numbers are correct, and they sit in the same annual report.
Free cash flow is the cash a business has left after paying to run itself and to buy the buildings and equipment it needs. The standard free cash flow formula is short: cash from operating activities minus capital expenditures. Net income is an accounting result; free cash flow is closer to what actually moved through the bank account. When the two point in opposite directions, the gap is usually the most interesting thing in the filing.
This post walks through the formula line by line, shows where each number lives in a 10-K, and then reads two real cases after the fact: Amazon in 2021 and Netflix between 2019 and 2023.
The free cash flow formula, line by line
Written out, the formula most companies and most textbooks use is:
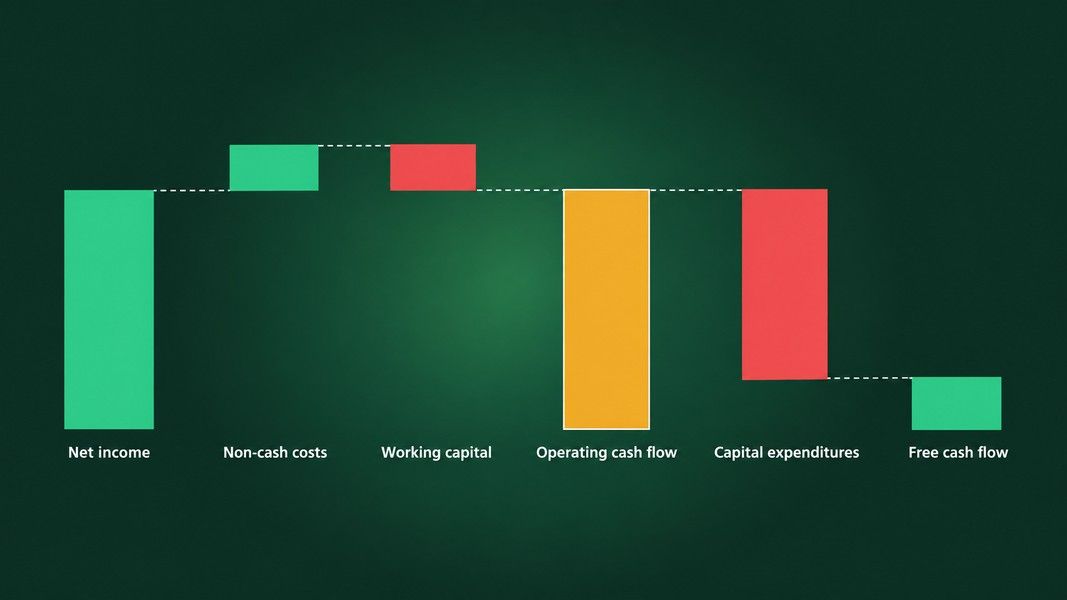
Free cash flow = net cash provided by operating activities - capital expenditures
The first term, operating cash flow, starts from net income and then corrects it for everything that was booked as income or expense without cash changing hands. Depreciation is added back, because it spreads the cost of a machine over years while the cash left when the machine was bought. Stock-based compensation is added back, because shares were issued instead of cash. Changes in working capital, meaning inventory, money owed by customers and money owed to suppliers, push the number up or down.
The second term, capital expenditures, is the cash spent on property and equipment during the year: warehouses, servers, trucks, data centers. It does not appear as an expense on the income statement in the year it is paid; it shows up slowly afterwards as depreciation.
That timing difference is the whole story. A company building aggressively pays for its assets now and expenses them later, so its free cash flow can sit far below its net income for years.
Where to find the numbers in a 10-K
You do not need a data terminal to calculate free cash flow. Both inputs are on the statement of cash flows, which US companies include in every 10-K and 10-Q.
Look for the line called "Net cash provided by (used in) operating activities". It closes the first block of the statement. Then go to the investing block and find the line for purchases of property and equipment; companies word it slightly differently, and Amazon writes "Purchases of property and equipment, net of proceeds from sales and incentives". Subtract the second from the first.
Many large companies save you the arithmetic. Because free cash flow is not defined by accounting standards, a company that quotes it in an SEC filing has to reconcile it to a GAAP measure, usually operating cash flow, most often in the management discussion section. That reconciliation also tells you which version of the formula the company chose, which matters more than it sounds, as two sections below will show.
If you have already read our piece on earnings per share, the habit is the same: before comparing a number across companies, check how each one built it.
Amazon 2021: record net income, negative free cash flow
Amazon's 2021 annual report on Form 10-K lays out both years side by side. The figures below are in billions of dollars, rounded from the millions the Amazon 10-K reports.
| Line | 2020 | 2021 |
|---|---|---|
| Net income | 21.3 | 33.4 |
| Operating cash flow | 66.1 | 46.3 |
| Purchases of property and equipment, net | 35.0 | 55.4 |
| Free cash flow | 31.0 | -9.1 |
Net income rose by about $12 billion. Free cash flow fell by about $40 billion. Two things drove the split, and the filing names both.
First, operating cash flow dropped from $66.1 billion to $46.3 billion, which Amazon attributed primarily to changes in working capital. Net income also carried a $14.3 billion non-cash item in "other income", which the cash flow statement takes straight back out because no cash arrived with it.
Second, capital spending jumped from $35.0 billion to $55.4 billion. That is cash spent on property and equipment in a single year, and it will reach the income statement only gradually, as depreciation, in the years that follow.
Neither number was wrong; they answered different questions. Net income said the business had a strong year on an accrual basis. Free cash flow said that, after paying for its build-out, the company consumed cash rather than produced it. Reading only the first would have missed what the second shows plainly.
Netflix: the gap that changed sign
Netflix shows the same mechanism with a different asset. For a streaming service, the big cash outlay is content: shows and films are paid for up front and amortized over the years they are expected to be watched.
The figures below come from Netflix's annual reports on Form 10-K, such as the 2020 10-K covering 2019 and the 2023 annual report, in billions of dollars.
| Year | Net income | Free cash flow | What the 10-K says drove the gap |
|---|---|---|---|
| 2019 | 1.87 | -3.27 | Cash paid for content exceeded amortization by 5.39 |
| 2022 | 4.49 | 1.62 | Cash paid for content exceeded amortization by 2.63 |
| 2023 | 5.41 | 6.93 | Amortization exceeded cash paid for content by 1.06 |
What the 10-K says changed
In 2019 free cash flow was $5.1 billion lower than net income, and Netflix's own explanation was content: it paid $5.4 billion more in cash for programming than it recognized as amortization expense that year.
By 2023 the relationship had flipped. Free cash flow came in $1.5 billion above net income, primarily because amortization of content already paid for was now larger than new cash going out the door for content.
The lesson is about direction, not about Netflix. When a company spends ahead of its expenses, free cash flow trails net income. When spending slows while the old spending is still being expensed, free cash flow overtakes it. The same business can show both pictures a few years apart.
Why earnings and cash disagree
The two cases share a pattern. Most gaps between net income and free cash flow come from a short list of causes, and the cash flow statement names each one on its own line:
- Capital spending ahead of depreciation: assets are paid for now and expensed over years, as with Amazon's 2021 build-out.
- Up-front spending on assets amortized later: Netflix's content works the same way as Amazon's servers.
- Working capital swings: inventory bought before it sells, or customers paying later, ties up cash that net income does not register.
- Non-cash income and expense: stock-based compensation, valuation changes on investments and similar items move net income without moving cash.
None of these is a red flag on its own. A gap with a clear, named cause, such as a build-out the company announced, reads very differently from a gap the filing does not explain. The useful question is not whether the numbers disagree, but whether the company tells you why.
This is also why free cash flow pairs well with leverage. A company with persistently negative free cash flow has to fund the difference from cash on hand, new shares or borrowing, which is where a look at the debt to equity ratio picks up the thread.
One name, several formulas
Here is the part most explainers skip. "Free cash flow" is not a defined accounting term, and companies do not all calculate it the same way.
The SEC's own staff guidance describes free cash flow as typically operating cash flow less capital expenditures, then warns that the measure does not have a uniform definition and that its title does not describe how it is calculated.
Amazon itself reports three versions in its 2021 filing. Besides plain free cash flow of -$9.1 billion, it shows free cash flow less principal repayments of finance leases and financing obligations at -$20.4 billion, and a third measure that subtracts equipment acquired under finance leases at -$14.3 billion. Amazon says it reports several measures to show the effect of acquiring property and equipment both with cash and through finance leases, which the plain formula does not capture.
The company adds a caution worth repeating: none of these measures represents the cash left for discretionary spending, because they leave out debt repayment and acquisitions. It recommends reading them only alongside the full cash flow statement.
When the name stops matching the formula
Some definitions drift further. In a 2024 comment letter exchange, SEC staff asked Archrock to rename measures it had called free cash flow, because the company built them from operating cash flow plus investing cash flow rather than the usual formula, and the shared name invited confusion. The company's response is public on EDGAR.
Before comparing free cash flow between two companies, open both reconciliations. If one subtracts lease payments and the other does not, the comparison is between two different measures with the same label.
What free cash flow does not tell you
Free cash flow has blind spots of its own.
It is lumpy. A single year of heavy construction can push it negative for a business that is otherwise healthy, as Amazon's 2020 and 2021 columns show side by side. One year says little; the trend over several years says more.
It does not separate maintenance from growth. Capital expenditures lump together the spending needed to keep current operations running and the spending on new capacity. The filing rarely splits the two, so a reader has to infer it from what management describes.
It treats stock-based compensation as free. Because shares replace cash, the standard formula adds that expense back, which flatters free cash flow at companies that pay heavily in stock. Amazon's stock-based compensation was $12.8 billion in 2021, a cost shareholders carry through dilution rather than through the cash line.
And it is backward-looking. Every figure in this post was read years after the fact, with the next periods already known. At the time, a reader of Amazon's 2021 report could see the negative number and its stated causes, but not how the following years would turn out.
Reading free cash flow beside the rest of a stock
Free cash flow is one input among many, and most investors look at it next to earnings, debt and growth rather than alone.
Primo Trade's ticker analysis pulls a US-listed stock's prices, recent news and financial metrics into one AI read. Fundamental is one of the five scores in the Primo Score, each from 0 to 100, and a Key Insight tagged fundamental can point at what stood out in the numbers. Primo Trade gives AI-generated analysis for information and education. It is not financial advice. Markets carry risk; do your own research before you trade.
A score is a summary, not a calculation you can audit line by line. For a question like the one in this post, why net income and cash moved apart, the 10-K's cash flow statement and its free cash flow reconciliation remain the place to look, and the app's AI read is a second opinion beside it.
The short version
The free cash flow formula is operating cash flow minus capital expenditures, and both inputs sit on the cash flow statement of any US-listed company.
Net income and free cash flow answer different questions. Amazon in 2021 and Netflix in 2019 both reported positive net income while free cash flow was negative, for reasons each filing named: a build-out paid for up front, and content paid for ahead of its amortization.
The gap can close and even reverse, as Netflix's 2023 numbers show, once spending slows while earlier spending is still being expensed.
"Free cash flow" has no single official definition. Check each company's reconciliation before comparing two of them, and read a single year as one point on a trend rather than a verdict.