On the morning of April 7, 2025, the S&P 500 was down 4.71% at its low, after two brutal sessions of tariff selling. By the close it had clawed back to a loss of just 0.23%. Within minutes, someone in every trading chat posted the daily candle with one word: hammer.
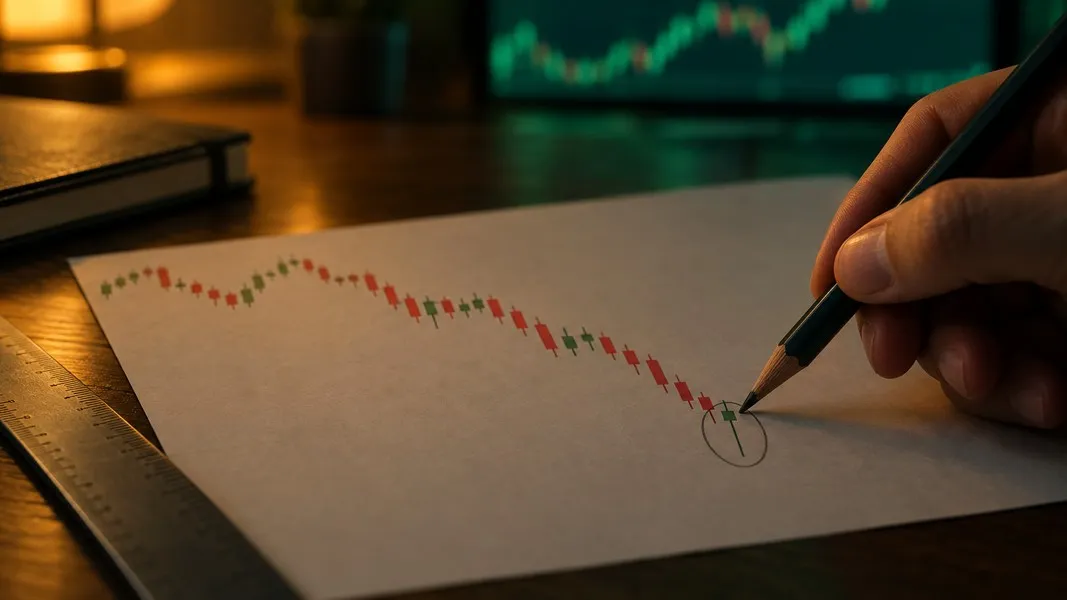
The hammer candlestick meaning is simple on paper. A hammer is a single candle that forms after a decline, with a small body near the top of its range, a long lower shadow and little or no upper shadow. It records that sellers drove the price well down during the session and buyers pushed it back up by the close. Thomas Bulkowski's tests found that it went on to reverse the downtrend 60% of the time.
That last number is where the myths start. This guide takes five things traders believe about the hammer, checks each against the testing, and then comes back to April 7 to see whether that candle was a hammer at all.
What a hammer candlestick records
Every candle carries four prices: open, high, low and close. The body spans the open and the close; the shadows, or wicks, reach out to the high and the low. If that anatomy is new, the candlestick chart basics cover it first.
In a hammer, the lower shadow does the talking. Bulkowski's identification guidelines on his pattern site ask for three things: a downward price trend leading into the candle, a lower shadow at least two or three times the height of the body, and little or no upper shadow.
What the shape records is a fight inside one session. Sellers pushed hard enough to open a deep hole below the open, then lost control, and the close landed near the top of the range. The candle is a record of that fight, not a forecast of the next one. Everything below follows from keeping those two apart.
Myth 1: A hammer means the bounce is coming
This is the belief that makes the hammer famous, and the testing gives it partial credit. Bulkowski tested 103 candlestick patterns across bull and bear markets. The hammer acted as a bullish reversal 60% of the time, which ranks 26th of 103 for reversals.
He is blunt about what that means: not bad, but not far from random, which would be 50%. And once price did turn up, it did not travel far. The hammer's overall performance rank is 65 of 103, where 1 is the pattern followed by the biggest moves.
| Measure | Hammer, as tested |
|---|---|
| Expected behaviour | Bullish reversal |
| Tested behaviour | Bullish reversal 60% of the time |
| Reversal rank | 26 of 103 |
| Overall performance rank | 65 of 103 |
| Frequency rank | 36 of 103 |
These are frequencies measured on a past sample, not odds for the next hammer you see. Four times in ten, by the same testing, price kept falling after a textbook hammer.
What to do instead: treat a hammer as a question the chart has asked, not an answer. Bulkowski counts a reversal only once price closes above the top of the candle, so the candle that follows decides more than the hammer itself does.
Myth 2: A red hammer is a failed hammer
"Red hammer candlestick" is a common search, and the worry behind it is reasonable: if the close is below the open, did the buyers really come out ahead?
The textbooks do not draw that line. StockCharts' ChartSchool guide describes the hammer and the hanging man as having small real bodies, black or white, with long lower shadows and short or missing upper shadows. Bulkowski writes of the hanging man, the hammer's identical twin, that candle colour is unimportant.
The reason is the size of the body. In a proper hammer the body is small next to the lower shadow, so whether the close sits a few cents above or below the open changes little. The long recovery from the low is the event; the colour is a rounding detail.
What to do instead: measure the shadow against the body. A green candle with a lower wick barely longer than its body is a weaker hammer than a red one whose wick is three times the body.
Myth 3: Any long lower wick is a hammer
The shape is easy to spot, which is exactly the problem. A long lower wick shows up everywhere, and most of those candles fail at least one of the three rules.
The trend before the candle is part of the definition, not a bonus. A long lower wick in the middle of a sideways range has no decline to reverse, so by the book it is not a hammer at all. The same goes for a candle with a tall upper shadow as well as a tall lower one: that is a candle where both sides pushed and neither held, closer to a spinning top than to a hammer. Our guide to the doji types shows how candles with long wicks on both sides read.
What to do instead: run the three checks in order. Was the price falling into this candle? Is the lower shadow at least twice the body? Is the upper shadow small? A candle that fails any of them gets no name.
Myth 4: The hanging man is a different candle
It is the same candle. StockCharts puts it plainly: the hammer and the hanging man look identical, and only the price action before them and the confirmation after them decide which one you are looking at. After a decline it is a hammer. After a rise it is a hanging man, and theory says it warns of a top.
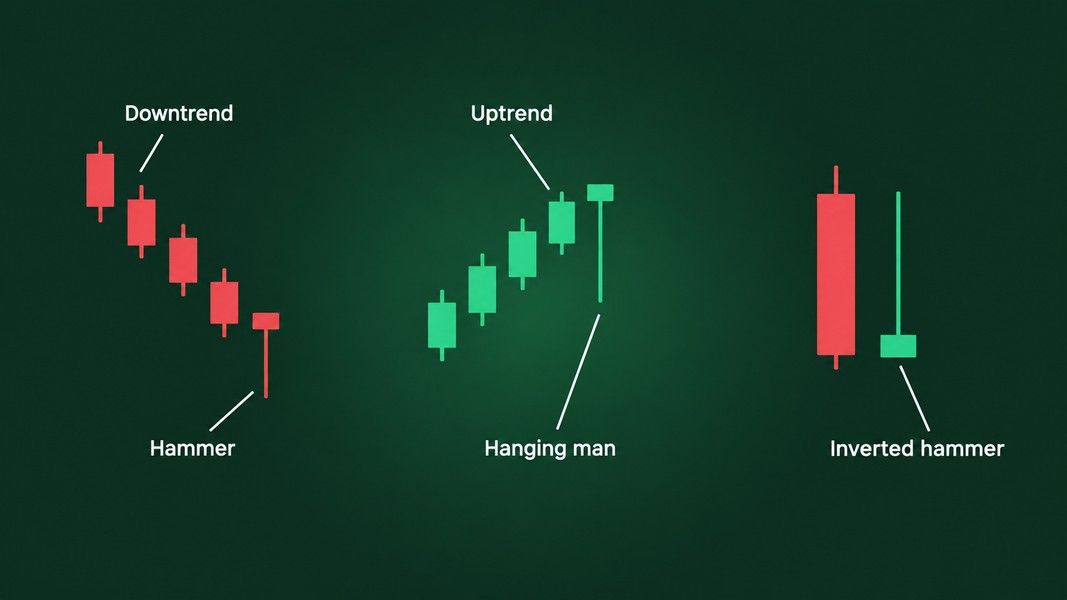
Testing is unkind to that warning. Bulkowski found the hanging man acted as a bullish continuation 59% of the time, the opposite of its textbook meaning, with an overall performance rank of 87 of 103. One of his notes adds that hanging man candles within a third of the yearly high tend to act as continuations of the main trend.
So the identical shape reversed a decline 60% of the time and failed to reverse a rise 59% of the time. Same candle, opposite records, which is why the trend before it carries so much of its meaning.
What to do instead: name the trend first and the candle second. If you cannot say which way price was moving into it, you cannot say which candle it is.
Myth 5: The inverted hammer is a hammer upside down
The inverted hammer flips the long shadow to the top: a small body near the low of its range and a tall upper wick. The intuitive reading is a mirror image, buyers trying to push up and getting a foothold.
Bulkowski admits he thought the same when he started. In his testing, though, the inverted hammer is a two-candle pattern: a tall black candle closing near its low, then the short candle with the tall upper shadow, which must open below the prior close and cannot be a doji. Read that way, it acted as a bearish continuation 65% of the time, not the bullish reversal its name suggests.
There is a twist that keeps it interesting. Its overall performance rank is 6 of 103, meaning that when price did break out, the move afterwards tended to be large. It is a candle that usually continues the decline and occasionally starts something big, which is a very different thing from a hammer upside down.
What to do instead: look for the tall dark candle before it, and wait for a close above the top of both candles before reading it as a turn.
The April 7, 2025 candle, read by the rules
Back to the candle from the opening. The decline was real: the S&P 500 had fallen hard for days after the April 2 tariff announcement, so the first rule passes.
The session itself was extraordinary. CNBC's live coverage recorded the index swinging from down 4.71% at its low to up 3.40% at its high in about 35 minutes, the largest intraday swing from down to up since November 2008, before it closed at 5,062.25, down 0.23%. The spark for the swing up was a report that President Trump was considering a 90-day pause on tariffs. Within about an hour the White House called it fake news, as Fortune reported in a piece on the false tariff report.
Now the third rule. The high sat more than three and a half percentage points above the close, so the candle had a tall upper shadow as well as a long lower one. By Bulkowski's own guideline of little or no upper shadow, April 7 was not a hammer. It was a candle where both sides ran the price a long way and neither kept it.
What the next two sessions showed
What came next shows why confirmation matters. On April 8 the index rallied early, then reversed and closed at 4,982.77, down 1.6% and below the April 7 close, its lowest close since April 2024. There was no close above the top of the candle until April 9, when an actual 90-day pause was announced and the S&P 500 rose 9.52% to 5,456.90.
If you had bought the hammer at the April 7 close, you would have sat through a lower close the next day. The candle's shape was half right and its story was a false headline. The move that followed came from a policy decision no candle could see.
A second read when the chart is unclear
The checks above are simple, but under pressure, with a red screen and a busy chat, it is easy to skip one. That is where a second read helps.
Primo Trade's Analyze Chart takes a photo or screenshot of a chart, and the AI reads the trend, volatility, volume and sentiment, names the chart pattern it sees and explains what that pattern usually signals. The result also includes a signal from Strong Buy to Strong Sell, which is the AI's directional read, not an instruction.
Primo Trade gives AI-generated analysis for information and education. It is not financial advice. Markets carry risk; do your own research before you trade.
An AI reading a screenshot sees the same candles you do. It cannot know that the recovery in a long lower wick came from a headline that was withdrawn an hour later, so it is a check on the shape, not on the news behind it. For the shape itself, the candlestick patterns cheat sheet puts the hammer and its lookalikes side by side.
Five questions before you call it a hammer
Most misread hammers fail one of these, and none of them takes more than a glance:
- Was price falling into the candle? No decline, no hammer.
- Is the lower shadow at least twice the body? Bulkowski asks for two or three times.
- Is the upper shadow small? A tall one turns it into a different candle.
- Did the next close go above the top of the candle? Until it does, the reversal is unconfirmed.
- Why did the session move? A market-wide shock or a single headline can draw a perfect shape that says nothing about the stock.
Conclusion
A hammer candlestick records one thing well: sellers pushed the price down hard and buyers brought it back by the close. In Bulkowski's testing that was followed by a reversal 60% of the time, with moves that ranked in the lower half of 103 patterns, which is useful evidence and a long way from a signal on its own.
The myths come from asking the candle to say more than it can. Colour matters little, the trend before the candle decides its name, the hanging man and the inverted hammer behave differently from what their names promise, and the candle after the hammer carries the confirmation. April 7, 2025 had the drama of a hammer without the shape of one, and the move that followed came from news the chart could not hold.