A stock climbs for six sessions, then prints a candle with almost no body and a wick on each side. Someone in a trading chat calls it the top. A doji candlestick is a candle whose open and close sit at or very near the same price, so the session ended roughly where it began. It records a standoff between buyers and sellers, and on its own it does not say which side comes out ahead.
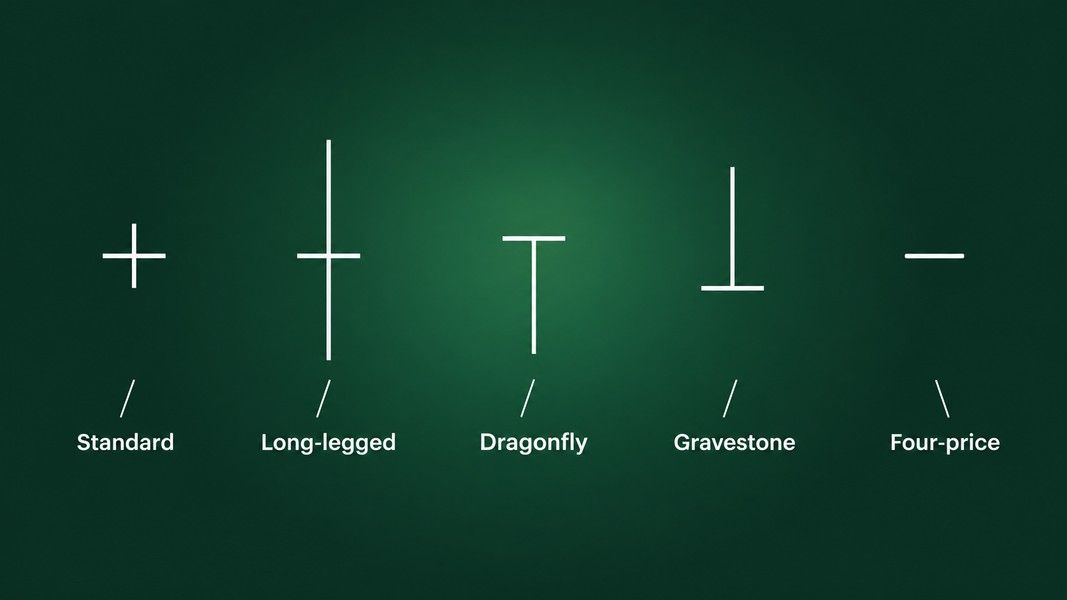
There are five common types, and each comes with a story traders like to tell about it. Testing across millions of candles found that most of those stories hold about half the time. This guide walks through each type: what the shape shows, what the tests found, and what has to happen next before a doji tells you anything.
What a doji candlestick actually records
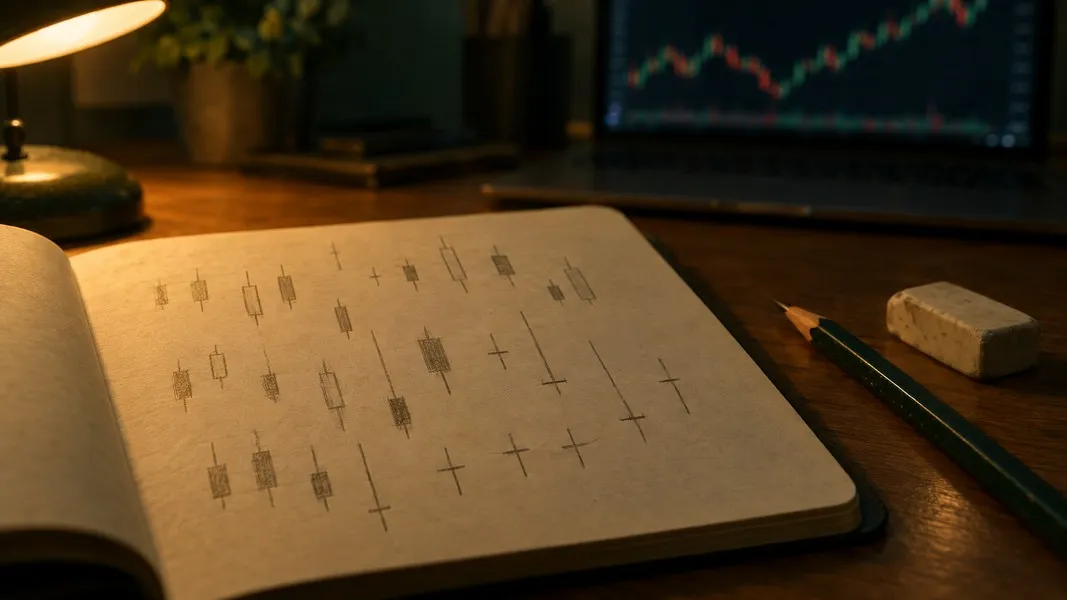
A candle has four prices: open, high, low and close. The body spans open to close, and the wicks, or shadows, reach out to the high and the low. In a doji the body shrinks to a thin line, because the close landed back at the open after price moved around during the session.
StockCharts' ChartSchool guide describes the result as looking like a cross, an inverted cross or a plus sign, and puts the key point plainly: alone, doji are neutral patterns, and any bullish or bearish bias comes from the price action before them and the confirmation after them.
"Near the same price" depends on the stock. The same guide gives a scale: a 20 dollar stock might form a doji with a 0.125 point gap between open and close, while a 200 dollar stock might form one with a 1.25 point gap. What matters is that the body looks like a thin line next to the candles around it.
Context changes the weight of a doji too. The same guide cites Steve Nison, who noted that a doji among other small-bodied candles is not important, while a doji that appears among candles with long bodies deserves attention. A doji is only as loud as the candles around it. If candle anatomy is new to you, the candlestick chart basics cover the parts first.
How the doji types were tested
The numbers in this guide come from Thomas Bulkowski, who tested 103 candlestick patterns for his Encyclopedia of Candlestick Charts, using almost 5 million candle lines across bull and bear markets. He counts a breakout as a close above the top of the candle or below its bottom, then measures whether price reversed the prior trend or continued it.
Two numbers matter for each type. The reversal or continuation rate says how often price went the way the textbook story expects. The overall performance rank, from 1 to 103, says how far price tended to travel after the breakout, with 1 being the strongest mover.
| Doji type | The story traders tell | Tested behaviour | Performance rank |
|---|---|---|---|
| Any doji in an uptrend (northern) | Bearish reversal | Bullish continuation 51% of the time | 83 of 103 |
| Any doji in a downtrend (southern) | Bullish reversal | Bullish reversal 52% of the time | 78 of 103 |
| Long-legged doji | Big move coming | Bullish continuation 51% of the time | 37 of 103 |
| Dragonfly doji | Bullish reversal | Reversal 50% of the time | 98 of 103 |
| Gravestone doji | Bearish reversal | Bearish reversal 51% of the time | 77 of 103 |
These are measured frequencies from a past sample, not odds for the next candle you see. A rate of 50 to 52% is a coin flip, and Bulkowski calls it random himself. The four-price doji is not in the table: none of the tested figures here cover it, for reasons the fifth section makes clear.
1. The standard doji: the plain cross
The standard doji has a thin body and short wicks of roughly equal length. It is the most common shape, and its traditional reading depends entirely on where it shows up.
After a rise, or after a long white candle, StockCharts reads a doji as a sign that buying pressure may be weakening. After a fall, or after a long black candle, it reads the same shape as selling pressure easing. The guide adds the condition that matters: on their own, doji are not enough to mark a reversal.
Bulkowski's tests back that caution. He calls any doji that forms in an uptrend a northern doji and any doji in a downtrend a southern doji. The northern doji is supposed to signal a bearish reversal, yet in his sample it acted as a bullish continuation 51% of the time. The southern doji is supposed to signal a bullish reversal, and it did, 52% of the time.
Both are also very common. The southern doji ranks 8th for frequency out of 103 patterns, and the northern doji ranks 6th, which Bulkowski compares to finding sand at a beach.
That is where the standard doji misleads. Because it appears so often, spotting one after a rise feels like evidence, when the tested record says the next move was close to random. Treat it as a reason to watch the next candle closely, not as a call on direction.
2. The long-legged doji: a loud session that went nowhere
A long-legged doji has long upper and lower shadows, often close to equal, around a body that is barely there. Price traded well above and well below the open during the session and still closed almost exactly where it started. StockCharts sums it up as a whole lot of yelling and screaming with little change at the end.
The usual story is that this much indecision comes before a big move. Bulkowski's verdict on the long-legged doji is blunt: it means nothing, and his tests show the breakout direction is random. It acted as a bullish continuation 51% of the time.
Two details are worth keeping. Its overall performance rank is 37 out of 103, the best of the doji types in his tests, so price did tend to travel after the breakout. And candles with shadows taller than the median saw price move 50% farther than those with shorter shadows.
So the long-legged doji says something about size and nothing about direction. That fits how Investopedia frames doji in general: common in periods of consolidation, and useful for spotting a potential breakout, with some analysts reading reversal and others reading a pause before the trend continues. The misleading part is reading a direction into a candle whose whole message is that nobody knew the direction.
3. The dragonfly doji: the T that is supposed to be bullish
The dragonfly doji forms when the open, high and close are equal and the low leaves a long lower shadow. It looks like a capital T. Sellers drove price down during the session, then buyers pushed it all the way back to the open by the close.
That recovery is why many traders read the dragonfly as bullish. StockCharts is more careful. After a long downtrend, a long black candle or at support, it could signal a potential bottom. After a long uptrend, a long white candle or at resistance, the same long lower shadow could foreshadow a top. Confirmation is required in both cases.
The dragonfly doji tests show it reversed the prior trend 50% of the time. Its overall performance rank is 98 out of 103, near the bottom, and Bulkowski's advice is not to expect price to trend for long after one. Because the close is pinned at the top of the candle, upward breakouts were the more common outcome, which is a different thing from a reversal.
His own worked example shows the trap. A dragonfly formed at the end of an uptrend, where the long lower shadow invited a bullish read. Price broke out downward instead and gave back about half of the prior rise before climbing again.
4. The gravestone doji: the rally that failed
The gravestone doji is the dragonfly upside down. The open, low and close are equal, and the high leaves a long upper shadow. Buyers pushed price up during the session, and sellers dragged it back to the open, which was also the low, by the close.
It is the candle traders most often treat as a warning at the top of a run. In Bulkowski's sample the gravestone doji did act as a bearish reversal, but only 51% of the time, and it ranked 77 out of 103 for performance, so price did not usually trend far after the breakout. He also found it far more often in bull markets than in bear markets, at a ratio of about 15 to 1.
His testing points to where it is least useful. He advises ignoring gravestone doji that form in congestion areas, the sideways stretches where price has no trend to reverse. Taller gravestones did better: those taller than the median saw price move about 50% farther after the breakout.
StockCharts adds the other half of the picture. The long upper shadow shows a failed rally, but the high itself shows that buyers were active. After a downtrend or at support, that buying pressure can matter more than the failure.
5. The four-price doji: the dash
The four-price doji is the rarest shape: open, high, low and close are all the same price. There is no body and no wick, only a short horizontal dash.
Four equal prices mean every trade in the session happened at one price. That takes either very thin trading or a bar short enough to hold a single price, so on the daily chart of a busy stock it is a rare sight.
It is also the one doji that offers nothing to read. There is no shadow to show a rejected push and no range to show a fight. It tells you that price did not move, and often that very few shares changed hands. None of the tested figures in this guide cover it, and there is little a test could measure.
The misleading part here is subtler: a run of four-price doji on a thin stock can make a chart look calm when the real story is a lack of trading. Check volume before reading anything into a dash.
Why every doji needs the next candle
This is the most important point in the guide. A doji is a pause, and a pause only becomes a turn when the next candles confirm it.
StockCharts spells out what confirmation looks like. After a rise and a doji, bearish confirmation could come as a gap down, a long black candle or a decline below the open of the long white candle before the doji. After a fall and a doji, bullish confirmation could come as a gap up, a long white candle or an advance above the open of the long black candle before it. Greg Morris adds a simpler test in Candlestick Charting Explained: a reversal pattern needs a prior trend to reverse.
Before reading a doji as anything more than a pause, run through a few checks:
- Is there a clear trend before it, or is price moving sideways?
- Is the body thin compared with the candles around it, the way Nison describes?
- Does it sit at a level that matters, such as support, resistance or a recent high or low?
- How long are the shadows compared with recent candles?
- Did the next candle close beyond the doji's high or low, and in which direction?
Bulkowski's data adds one more pattern across several types: long-legged, dragonfly, gravestone and southern doji that formed within a third of the yearly low performed best in his sample.
A gravestone that did not reverse
Here is how the coin flip plays out on a chart. A stock rises for a week and prints a gravestone doji right at last month's high. The bearish read is tempting. The next session opens higher and closes above the gravestone's high. By Bulkowski's definition, that is an upward breakout: the gravestone did not reverse anything. That outcome is the other 49% in his sample, and it is why a doji earns a second look rather than a decision.
Where Primo Trade fits
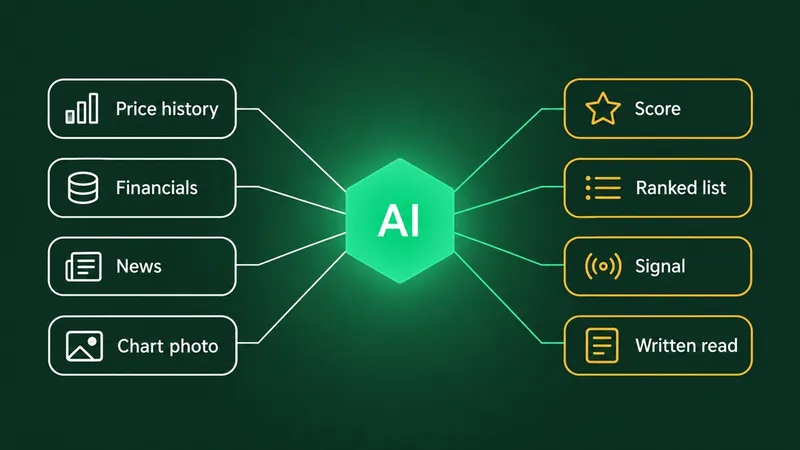
A doji's meaning sits in its surroundings: the trend before it, the level it formed at, the candle after it. That is the kind of context Primo Trade's Analyze Chart reads. You take a photo or screenshot of a chart, and the AI reads the trend, volatility, volume and sentiment, names the chart pattern it sees and explains what that pattern usually signals.
The result carries a signal, from Strong Buy to Strong Sell, which is the AI's directional read and not an instruction, alongside a Primo Score, a Trading Strategy and Key Insights. It works as a second opinion on a chart you are already looking at, especially when a doji has you second-guessing what you see.
Primo Trade gives AI-generated analysis for information and education. It is not financial advice. Markets carry risk; do your own research before you trade.
The honest limit applies here too. An AI read of a chart runs into the same problem as a human one when a doji sits alone without confirmation, and a screenshot without a ticker or an axis gives it less to work with. The post on how AI reads a chart covers where that reading goes wrong. For the shapes on one page, the candlestick patterns cheat sheet lists every common candle, and the chart patterns cheat sheet covers the larger formations a doji often sits inside.
The short version
A doji candlestick records a session that ended where it began. The standard, long-legged, dragonfly, gravestone and four-price types each describe how price got there, and each has a traditional story attached.
Bulkowski's tests on almost 5 million candle lines found those stories held about half the time: 50% for the dragonfly, 51% for the gravestone and the long-legged doji, 51 and 52% for doji in uptrends and downtrends. The long-legged doji showed the most movement after a breakout, without a reliable direction.
What turns a doji from noise into information is everything around it: a real prior trend, a thin body among long ones, a level that matters, and above all a next candle that closes beyond its range. Without those, a doji is a pause, and reading it as more is where it misleads.