You add a moving average to a TradingView chart, then RSI, then reach for volume bands, and the free plan says no. Two indicators per chart is the ceiling on Basic. That moment sends a lot of people looking for TradingView alternatives, and the good news is that several of them give you more room for free.
The short answer: StockCharts and TC2000 give a free chart more room, thinkorswim is the strongest free option if you already have a Schwab account, TrendSpider is the pick for automated trendlines and pattern recognition, Koyfin for fundamentals on a chart, and Finviz for screening. And if what you want is not another platform but a second read of the chart you already have, that is a different tool, which is where Primo Trade, our own product, comes in. It gets the same treatment below, gaps included.
Every plan detail here was read on each vendor's own site on November 4, 2026, for US stocks. Prices are left out because they change too often, and plans can differ by country, so treat this as dated to that day.
Why People Look for TradingView Alternatives
TradingView deserves its reputation. Its plan comparison lists 400+ built-in indicators, 100K+ community indicators, Pine Script for writing your own, and web, desktop and mobile apps. The screeners cover 150+ exchanges in 50+ countries. Few charting tools match that breadth.
The friction sits in the free Basic plan. According to TradingView's own plan comparison, Basic gives you:
- One chart per tab and one saved chart layout
- Two indicators per chart
- Three active price alerts, and no technical alerts on indicators or drawings (those start at 20 on the first paid plan)
- One watchlist of 30 symbols and 5K historical bars
- A screener limited to daily, weekly and monthly timeframes, with two active filters
None of that is unreasonable for a free tier. But a swing trader who wants a moving average, RSI and MACD on one chart has already run out of room, and anyone tracking more than 30 tickers hits the watchlist cap in an afternoon.
So the real question is not which tool is best, but which limit is bothering you. More indicators, more alerts, automated drawing, fundamentals on the chart and a quick screen are five different problems with five different answers.
TradingView Alternatives at a Glance
| Tool | Best for | Free option | Main catch |
|---|---|---|---|
| TrendSpider | Automated trendlines, pattern recognition, backtests | No free plan for the platform | A lot of platform if you only want charts |
| StockCharts | Classic charting with more indicators on free | Free level, plus a free first month | Charts refresh rather than stream |
| thinkorswim | Deep charting inside a brokerage | Free for Schwab clients, 30-day Guest Pass | Needs a Schwab account to keep using |
| TC2000 | Fast US stock and option charts | Free layout, no credit card | Delayed data on the free layout |
| Koyfin | Fundamentals and valuation on a chart | Free plan with advanced charting | Leans on financial data over drawing tools |
| Finviz | Screening the whole US market | Free registered account | Interactive charts are paid only |
| Primo Trade | An AI second read of one chart or ticker | Free to download, with free analyses to start | Not a charting platform at all |
TrendSpider: Automation Instead of Drawing by Hand
TrendSpider is the alternative for people who are tired of drawing the same trendlines every morning. Its pricing page lists automated trendlines and Fibonacci levels, chart pattern recognition, 300+ indicators, multi-timeframe analysis, strategy backtesting, scheduled market scans and trading bots.
One detail sets it apart from TradingView's tiering: every plan includes every feature. What changes between plans is the count, such as open workspaces, active alerts and how far back a backtest can reach. The smallest plan listed allows five open workspaces and ten alerts that stay active for 30 days.
It also has Sidekick, a built-in AI chatbot, and the plan page lists machine vision analysis powered by it, so you can ask it about a chart. Real-time data for US stocks and ETFs is included for non-professional users.
Where TrendSpider Falls Short
There is no free plan for the platform itself, only free market pages, daily scanner emails and a learning center. And if your goal is a clean chart with three indicators, TrendSpider is a lot of machinery for that job. It suits a trader who will actually use the scans, alerts and backtests.
StockCharts: More Room on a Free Chart
StockCharts is the most direct fix for the two-indicator ceiling. Its service levels table gives the free level three indicators and three overlays per chart, so a moving average, Bollinger Bands and a volume overlay can sit on one chart with RSI, MACD and a stochastic below it.
Paid levels raise that to 25 indicators and 25 overlays per chart, add saved ChartLists, scans and scheduled scans, and start price alerts at two on the entry level and 500 on the top one. Paid historical charting starts in 1980, and the top level goes back to 1900.
The chart types are where StockCharts feels different from TradingView: Point and Figure, Relative Rotation Graphs, seasonality charts and PerfCharts, alongside the usual candlestick, Renko, Kagi and Heikin-Ashi. Its free data plan uses BATS real-time data for US stocks, and every new trial gets the first month free at its middle level.
Where StockCharts Falls Short
Its own FAQ says the charts refresh automatically every few seconds rather than streaming tick by tick. For a daily or weekly chart that hardly matters; for a five-minute chart during the open it might. The free chart is also capped at 900 pixels wide.
thinkorswim: Free Depth if You Have a Schwab Account
If you already have a brokerage account at Charles Schwab, thinkorswim is probably the strongest free charting package on this list. Schwab's platform FAQ says clients get the whole thinkorswim suite at no charge, across desktop, web and mobile.
The desktop version lists 400+ technical studies, special chart types such as Monkey Bars and Renko, and up to 20 drawings with eight Fibonacci tools. You can also set alerts on chart drawings like trendlines and retracement levels, so a line you drew becomes a level the platform watches for you.
Where thinkorswim Falls Short
A Schwab account is required to log in. Without one, the option is a 30-day Guest Pass, after which you either open an account or move on. It is also built as a trading platform first, so the screen is dense with order tools, option chains and risk analysis that a chart reader may never touch.
TC2000: Quick Charts Without Handing Over a Card
TC2000 lets you try its platform without giving a name, address or credit card, according to its features overview. You open the web platform or download the Windows desktop and get a basic layout with charts for all US stocks and options, dozens of indicators, delayed streaming data, option chains, a notepad and a favorites watchlist.
It runs on Windows, Mac, iOS, Android and the web. Chart-side tools are practical rather than flashy: you can measure swing sizes, write notes on the chart that are saved for next time, and drag limit and stop orders straight onto price levels. A trading simulator allows unlimited paper accounts for testing an idea without real money.
Where TC2000 Falls Short
The free layout runs on delayed data. Real-time US stock data from Nasdaq Basic starts on the paid levels, and the trading features tie into TC2000's own brokerage. The focus is US stocks and options, so anyone charting other markets will feel the edges quickly.
Koyfin: When the Chart Needs Fundamentals
Koyfin approaches charting from the other side. Its free plan, per Koyfin's own plan page, includes advanced charting, two watchlists, two screens, two custom dashboards, two years of financials and one year of estimates.
Its graphs can plot more than 100 series covering fundamentals, technicals, performance, valuation, consensus estimates and analyst ratings. That makes it the natural pick when your question is less "where is support" and more "how did the valuation move while the price did this". Scatter charts compare many stocks at once, chart templates reuse a setup across tickers, and charts export as PNG.
Where Koyfin Falls Short
Its feature pages lead with financial data, dashboards and valuation rather than drawing tools or pattern recognition. A trader who lives on trendlines and candlestick shapes may find TradingView or StockCharts more natural, and the free plan's two years of financials is short for a long-term view.
Finviz: The Screener That Also Charts
Finviz is where many traders go to find a stock rather than to study one. Its plan page shows the free registered account with basic screener filters, 50 saved presets and 20 rows per page, with quotes delayed one minute for NASDAQ, NYSE and AMEX.
The paid Elite plan adds real-time data including premarket and after-hours sessions, an ad-free interface, advanced filters, unlimited alerts and an interactive charting suite with up to 12 charts per layout. Its charts also mark patterns automatically, and there is a free trial of Elite.
Where Finviz Falls Short
On the free account the interactive charting suite, multi-chart layouts and every kind of alert are not included, and ads stay on. So as a TradingView replacement for charting, free Finviz does not get far. As a way to narrow the US market down to ten stocks worth opening on another platform, it is hard to beat.
Primo Trade: A Second Read, Not Another Platform
Primo Trade is not a TradingView alternative in the charting sense, and it would be dishonest to pretend otherwise. It has no drawing tools, no indicators to add, no alerts, no screener and no watchlist. What it does is read a chart you already have.
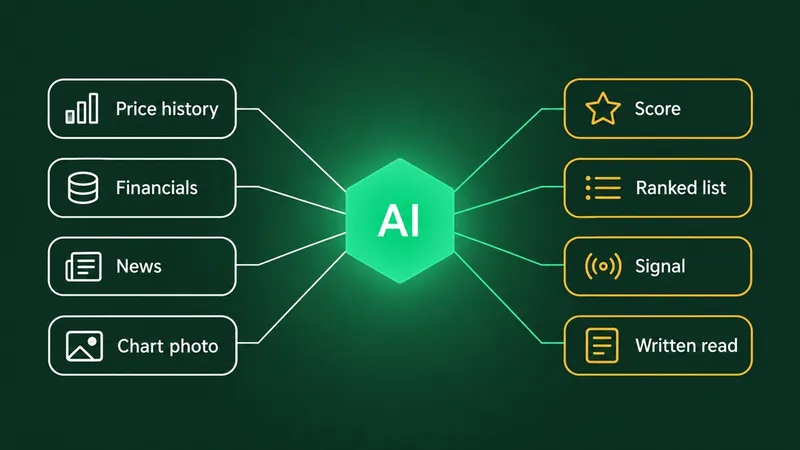
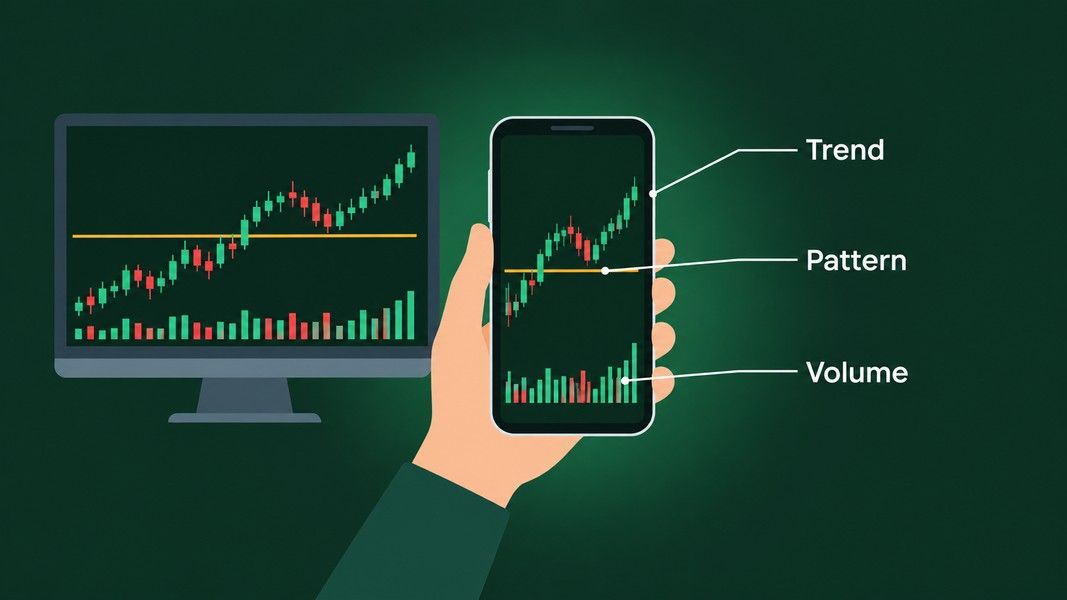
You take a photo of a chart on your monitor or choose a screenshot from your gallery, from TradingView or any of the platforms above, and the AI reads the trend, volatility, volume and sentiment, names the chart pattern it sees and explains what that pattern usually signals. Or you type a US ticker and it runs an analysis over prices, recent news and financial metrics instead.
What You Get Back
Every result carries a Signal from Strong Buy to Strong Sell as the AI's directional read, a Primo Score across risk, sentiment, technical, fundamental and growth, a Trading Strategy idea with a risk level, and up to three Key Insights. A ticker analysis adds a price chart, Recent News and a Forecast Value, the model's 6 to 12 month estimate.
Primo Trade gives AI-generated analysis for information and education. It is not financial advice. Markets carry risk; do your own research before you trade.
Where Primo Trade Falls Short
It covers US-listed stocks and ADRs only, about 16,000 symbols, and it runs on iOS and Android with no web version. A chart photo cannot tell the AI the ticker or the timeframe unless they are visible, which is a real limit our guide to how AI reads a stock chart goes through in detail. It is free to download, with free analyses to start.
How to Choose the Right TradingView Alternative
Start from the limit that sent you looking, not from the brand:
- Too few indicators on a free chart: StockCharts, or TC2000 if you also want streaming charts and do not mind delayed data
- You already trade at Schwab: thinkorswim, since you have it at no extra charge
- Tired of drawing trendlines and hunting patterns by hand: TrendSpider
- You want valuation and estimates next to price: Koyfin
- You need to find candidates before charting them: Finviz
- You want a second opinion on a chart you already drew: Primo Trade, alongside whichever platform you chart on
Plenty of traders end up with two of these: one platform to chart on and one tool for a different job, whether that is screening, fundamentals or an AI read. If an AI read is the part you are weighing, our comparison of AI stock analysis tools sets out what each of them reads and hands back.
One caution that applies to every tool above: free tiers move. Check the vendor's own plan page on the day you decide rather than trusting any list, this one included.
Conclusion
TradingView's free plan stops most people at two indicators, three price alerts and one 30-symbol watchlist, and that is usually the limit that starts the search. StockCharts and TC2000 give a free chart more room, thinkorswim is the deepest free package for Schwab clients, TrendSpider automates the drawing, Koyfin puts fundamentals on the chart, and Finviz finds the stocks worth charting.
Primo Trade sits beside all of them rather than replacing any, as an AI read of a chart or ticker you already have. Pick by the limit you keep hitting, and check each plan page on the day you choose.