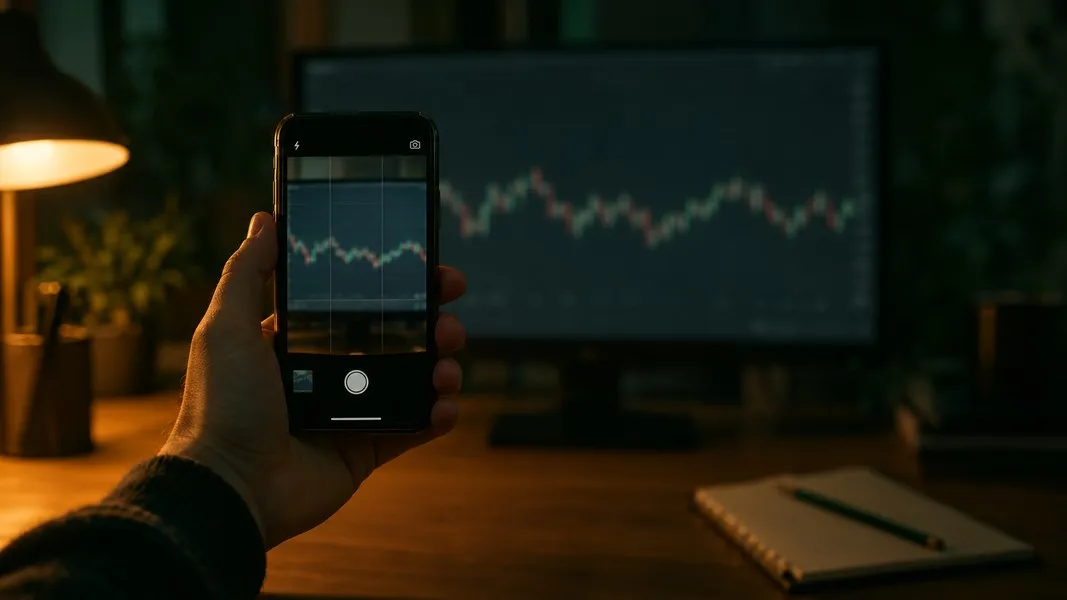
It is late, a chart on your monitor looks interesting, and you grab a screenshot on your phone. You crop it so it looks tidy, drop it into an AI and ask what it sees. Back comes a confident paragraph: a steady uptrend, a short pause that looks like a bull flag, volume picking up into the right edge.
Here is the question nobody asks at that moment. You cropped off the price axis, the ticker and the dates. So what exactly was the AI reading?
The shape. AI chart analysis works from the pixels in front of it, and a screenshot keeps the shape of the price while throwing away most of what gives that shape a meaning. This post walks through what an AI can read from a chart image, what it cannot know no matter how clever it is, where published research says these models slip, and a short routine for getting a read you can check.
What an AI Sees When It Reads a Stock Chart
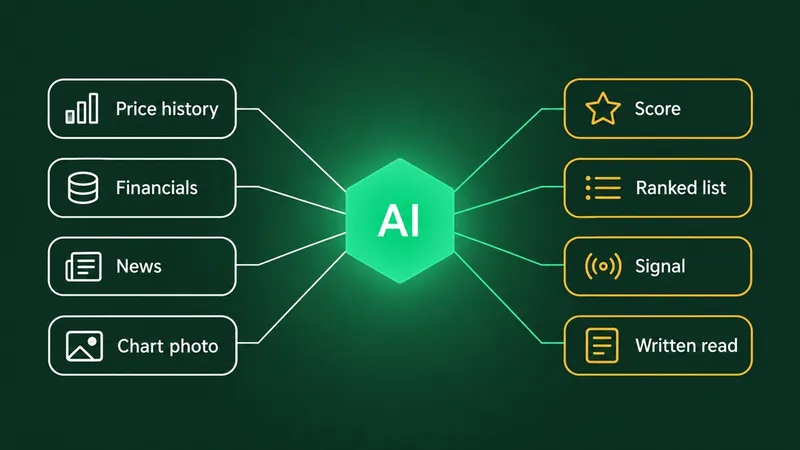
What the AI got from your crop was pixels, not prices. A multimodal model, the kind that takes in an image and text together, never sees the numbers behind a chart as a table. It sees lines, colours, candle bodies and maybe a few labels along the edges. From those it infers what the chart says, much as you would, and then puts it into words.
That has two consequences. The model can take in the overall shape of a chart fast, which is often exactly what you want from a second read. And everything it says depends on how well it read the picture, so a blurred photo, a cropped axis or an unusual chart style can change its answer.
Think of it as a very quick reader handed a page torn out of a book. It can tell you the story on the page. It cannot tell you which book it came from, or how the next chapter goes.
AI Chart Analysis: Readable Versus Missing
Some things live in the pixels. Others live in labels that a crop removes, and a few were never on the screen at all.
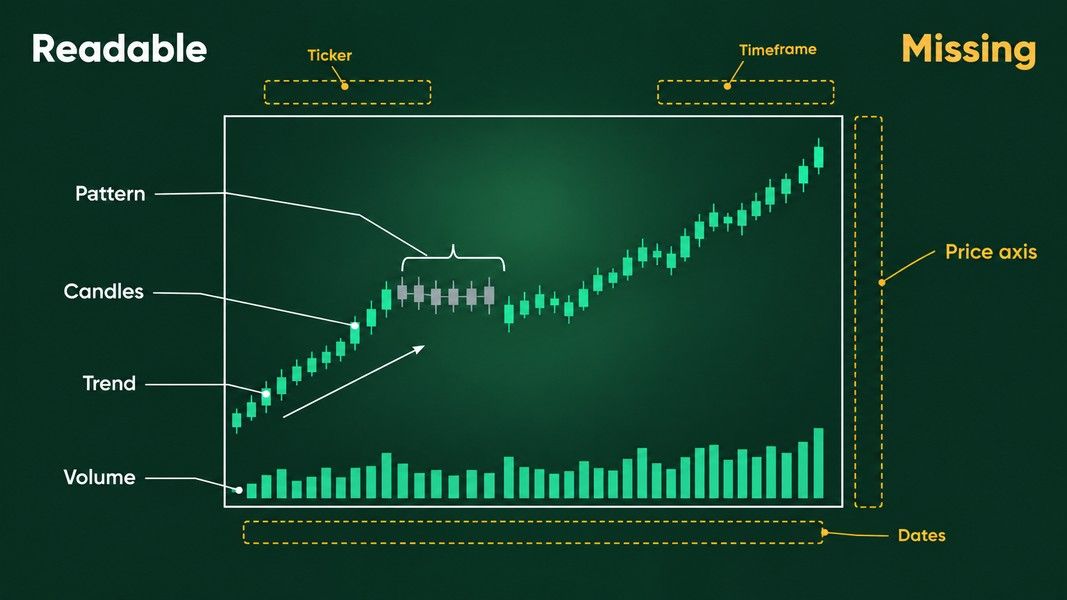
| What you want to know | In the pixels? | Where it has to come from |
|---|---|---|
| Direction of the trend | Yes | The candles themselves |
| Shape of a pattern, such as a flag or a double top | Yes | The candles themselves |
| Long wicks, small bodies, gaps between candles | Yes, if the image is sharp | The candles themselves |
| Whether volume rose or fell | Yes, if the volume bars are in frame | The volume panel |
| Which stock it is | No | The ticker label, or you |
| The price level, and how big a move was in percent | No | The price axis |
| Whether each candle is five minutes or one week | No | The timeframe label or the dates |
| When it happened, and what news was out | No | The dates, then a news check |
| What happened after the right edge | No | Nothing: no screenshot has it |
The top half of that table is where an AI chart read pulls its weight. The bottom half is where it can only guess, and a guess written in fluent sentences looks a lot like knowledge.
Three Things a Cropped Screenshot Throws Away
The timeframe
Traders have long said that charts look alike at every zoom level, and a famous mathematician took the folklore seriously. Benoit Mandelbrot, the man behind fractals, wrote that once a stock chart is enlarged or shrunk to fit the same frame, an observer cannot tell which data change week to week, day to day or hour to hour. He published that in Scientific American in 1999.
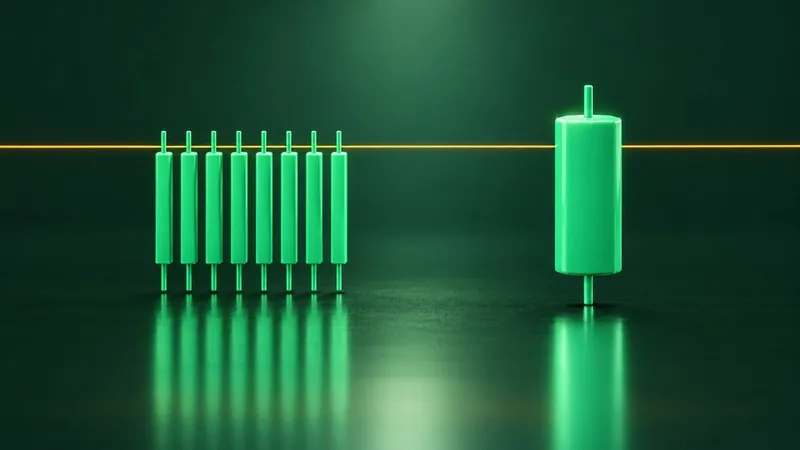
For a screenshot, that means a bull flag on a five-minute chart and a bull flag on a weekly chart can be the same picture. One describes an afternoon, the other most of a year. Without a timeframe label or readable dates, the AI cannot tell them apart, and neither can you.
The price axis
Without the axis, the AI cannot know whether the stock trades at 3 dollars or 300, or whether a tall candle was a 1% wobble or a 10% drop. Those are not small details.
The scale matters too. On a linear chart, a move from 10 to 20 takes the same height as a move from 70 to 80; on a log chart, equal percentage moves take equal height. Over a long stretch, the same prices drawn both ways can give different trendlines, and a screenshot rarely says which scale it used.
Reading values off an axis is also one of the weakest skills these models have. FinChart-Bench, the first benchmark built only from real financial charts (1,200 charts from 2015 to 2024 and 7,016 questions, posted in 2025 and presented at ACL 2026), found that models did relatively well when numbers were printed next to the points and poorly when a value had to be inferred from the axes. Its authors call spatial reasoning a significant bottleneck. A price chart is exactly that kind of chart: almost nothing is labelled, and everything is read against an axis.
The ticker
No ticker means no company, no earnings date and no news, so no way to know whether the gap on the right was a company announcement or a market-wide sell-off. An AI working from pixels alone reads the chart the way a technical analyst would with a sticky note over the name. That is an interesting exercise, and an incomplete one.
When the Picture Lies: Nvidia's Split in June 2024
Here is the failure case as one real, closed example from June 2024, read after the fact.
Nvidia split its stock ten for one that month. As Yahoo Finance reported on Monday, June 10, 2024, the shares began trading that day on the new basis, Friday's closing price of $1,208.88 was revised to $120.88, and the stock closed up nearly 1% on its first day after the split. Nothing bad happened to the company that weekend. Each shareholder simply held ten shares for every one.
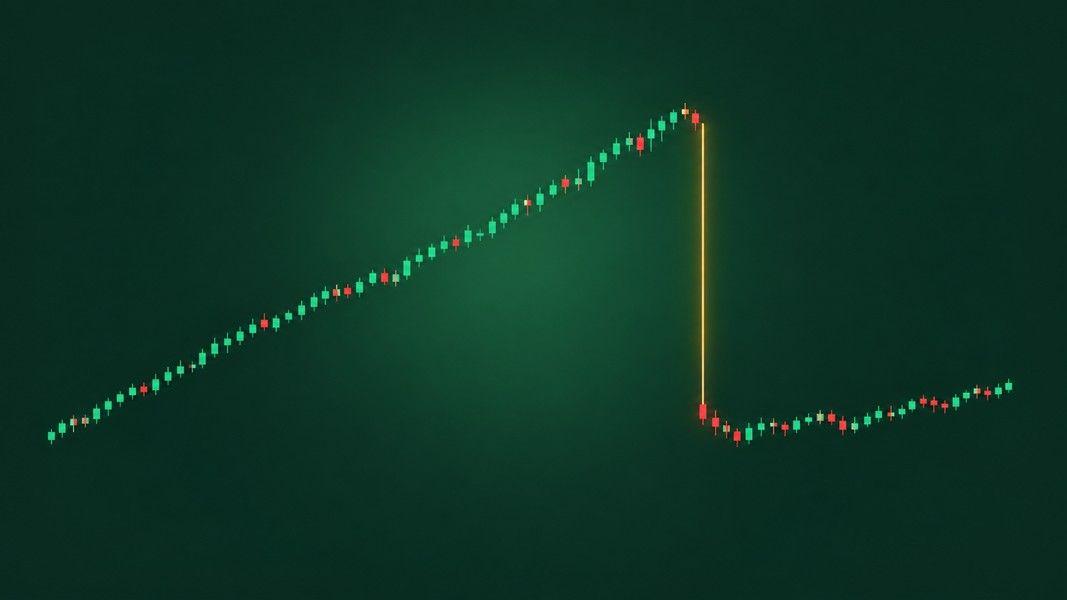
Now picture a chart that does not adjust its history for the split. It shows a stock that climbed for months and then lost about 90% over a weekend. StockCharts, which adjusts its own data for exactly this reason, warns that an unadjusted split gives the impression that something bearish happened, and that most technical indicators on such a chart would give sell signals.
Show a screenshot of that cliff to an AI with no ticker and no dates, and "a collapse" is a perfectly reasonable description of the pixels. It is also completely wrong. The fix is not a smarter model. It is context: the ticker, the date and a quick news check.
The general rule holds well beyond splits: the same picture of a price can come from two very different stories, and the picture alone cannot say which.
How Well AI Reads Charts: What the Benchmarks Say
So how often do these models get a chart right? Researchers measure it with benchmarks: sets of real charts with questions that have checkable answers.
Early ones such as the ChartQA benchmark, published in 2022, asked thousands of questions about charts, including questions that need arithmetic over the values shown, and models improved on them quickly. The authors of CharXiv, a 2024 benchmark, argued that such datasets used simple, uniform charts and template questions, which gave an over-optimistic measure of progress. When they changed the charts or questions only slightly, scores fell by up to 34.5%.
Harder tests, wider gap
Harder tests show a clear gap between models and people:
| Benchmark | What it tests | People | Best model at release | Best open-source model |
|---|---|---|---|---|
| CharXiv (2024), reasoning questions | 2,323 real charts from scientific papers | 80.5% | 47.1% (GPT-4o) | 29.2% |
| ChartMuseum (NeurIPS 2025) | 1,162 questions on real charts from 184 sources | 93% | 63.0% (Gemini 2.5 Pro) | 38.5% |
| FinChart-Bench (2025), open questions | 1,200 real financial charts | Not reported | 63.59% | 59.78% |
The ChartMuseum authors also split questions that need mainly visual reasoning from questions that lean on text. On the visual ones, every model they tested dropped 35% to 55% from its score on the text-heavy ones. In a synthetic test that could only be solved by looking, models got worse as the picture got busier, while people held steady. A price chart is almost all visual, so the parts that need careful looking, such as exact levels, small candles and crowded stretches, are where a model is most likely to slip.
CharXiv and ChartMuseum use scientific and general charts, FinChart-Bench's 14 chart types are bars, lines, pies and the like rather than candlesticks, and newer models keep raising the scores. The direction is still clear: on charts that need real looking, the best models trail people by a wide margin.
Can AI Predict a Stock From Its Chart?
The most cited research here is about text, not charts. Alejandro Lopez-Lira and Yuehua Tang had GPT-4 score news headlines published after its knowledge cutoff. The scores captured the market's first reaction to the news, which they describe as non-tradable, and also predicted some of the drift afterwards, especially for small stocks and bad news. The edge also shrank: in their data it faded as adoption of these models rose.
Testing such claims is tricky. Paul Glasserman and Caden Lin showed that backtests of AI news strategies can be quietly biased when the model already knows what happened to the stock after the news, or when its general knowledge of a company distracts it from the text in front of it.
None of this research shows that an AI reading a chart can tell you where a price will go. A chart is a record of past prices, and an AI read of it is one more reading of that same record: quick, often useful, and never a view of the future.
Confident, Fluent and Sometimes Wrong
The SEC, NASAA and FINRA, in a joint alert on AI and investment fraud, warn that even when the input is correct, AI output can be faulty, or even completely made up. The same alert quotes pitches such as "Our proprietary AI trading system can't lose!" as the kind to run from, and it urges caution about using AI-generated information to predict the market's direction or a stock's price, because it may rest on data that is incomplete, outdated or misleading.
The SEC has acted on overstated AI claims too. In 2024 it settled charges against two firms, Delphia and Global Predictions, for false and misleading statements about their use of AI, with $400,000 in penalties between them.
A chart description reads just as smoothly whether it is right or wrong. So the useful habit is neither trusting nor distrusting the AI. It is checking it.
How to Get an AI Chart Read You Can Check
- Keep the labels in. Crop to the chart, but leave the ticker, the price axis and the dates in frame. They are the whole bottom half of the table above.
- Name the timeframe if it is not shown. "Daily candles, about six months" changes what a pattern means.
- Shoot straight and sharp. A photo of a screen at an angle, with glare, blurs the small candles a model already finds hardest.
- Check every claim against the chart. If it names a level or a pattern, find it yourself. You can only do that if you can read the chart, which our guides to reading candlestick charts and bullish and bearish chart patterns cover.
- Ask what it cannot see. A good follow-up is "what would change this read?" Earnings next week, a split or a market-wide drop are all invisible in a cropped chart.
- Plan for being wrong. Decide in advance where you would get out. Our guide to what a stop-loss is explains how.
How Primo Trade Reads a Chart Photo
Primo Trade lets you take a photo of a chart or choose a screenshot from your gallery. Its AI reads the trend, volatility, volume and sentiment it sees, the chart pattern, and what that pattern usually signals. Our chart patterns cheat sheet shows what confirms each one. If the image is not a chart, the app says so instead of guessing.
The limits in this post apply to it as well, and our comparison of AI stock analysis tools sets it beside six others. When the AI can read a US ticker on the image, the app runs the full ticker analysis instead, pulling prices, financial metrics and recent news before the AI writes, and the result adds a price chart and a Forecast Value, the model's 6 to 12 month estimate. When it cannot read a ticker, it works from the image alone, so the result has no price chart, no Forecast Value and no news. One more reason to keep the ticker in frame.
Either way, the result shows a signal from Strong Buy to Strong Sell as the AI's read, a Primo Score of five ratings from 0 to 100, a Trading Strategy idea with a risk level, and Key Insights. A Risk score of 80 is a rating on a scale, not an 80% chance of anything.
Primo Trade gives AI-generated analysis for information and education. It is not financial advice. Markets carry risk; do your own research before you trade.
What an AI Chart Read Is Good For
An AI reads a stock chart the way it reads any image: from pixels into words. From a screenshot it can describe the trend, the candles, the pattern and the volume in seconds. It cannot know the ticker, the price level, the timeframe or the date unless they are in the picture, and the best models still trail people on charts that need careful looking, most of all when a value has to be read off an axis.
So keep the labels in, check what it says against the chart, and treat it as a quick second opinion on past prices. Any tool that claims an AI can see the future in a chart is the warning sign regulators describe.