On April 8, 2025, the S&P 500 closed 18.9% below its February record, and the evening coverage said it was inches from a bear market. It never became one. By the closing-price rule, the index stopped 1.1 percentage points short, and the drop went into the record as a correction.
That near miss is the whole bull vs bear market question in one day. A bear market is a fall of 20% or more from a closing high, and a bull market is a rise of 20% or more from a closing low, but how long each one lasts depends on who is counting. Since 1928, bear markets in the S&P 500 have lasted about 9.6 months on one count and close to 19 months on another. Both numbers are honest. They measure different things.
This post lays the counts side by side, explains why they disagree, and shows why neither label can be read off a chart in real time.
Bull vs bear market: the key numbers
Here is what the published research agrees on, before the detail:
- Bear markets are shorter than bull markets in every count, and usually by a wide margin.
- The typical bear market fell about a third from its peak: 33% to 38%, depending on the source.
- The shortest bear on record lasted 33 days, in 2020. The longest, measured from 1872, ran 113 months.
- There have been more bear markets than recessions, so a falling market does not always mean a shrinking economy.
- Both labels are only certain after the fact, because the threshold has to be crossed before anyone can date the turn.
The rest of this post is where those numbers come from, and why the same history can produce different ones.
What counts as a bull or bear market
The common rule is simple. A bear market starts when a broad index such as the S&P 500 closes at least 20% below its most recent high. A drop of 10% to 19.9% is a correction. A new bull market begins when the index closes 20% above its low.
The word that does the work is "closes". In April 2025 the S&P 500 traded below the 20% line during the session, but on the closing measure it never got there. The rule ignores intraday lows on purpose: a few panicked hours do not make a regime.
Bull markets have the looser definition of the two. According to Fidelity's explainer, the SEC describes a bull market as a broad index rising 20% or more over at least two months, while other sources set no exact threshold at all and simply look for new highs.
The 1990 edge case
Thresholds create strange edges. In 1990 the S&P 500 fell 19.9%, a hair short of the bear line. Because of that missing tenth of a point, the bull market that began in December 1987 is technically the longest on record, running until the dot-com crash in March 2000.
How long bear markets last, by four counts
Ask four research houses how long a bear market lasts and you get four answers. The table puts them next to each other.
| Source | Period | Bear markets counted | Typical length | Typical decline |
|---|---|---|---|---|
| Ned Davis Research, via Hartford Funds | 1928 to 2024 | 27 | 289 days on average (9.6 months) | 35% on average |
| Fidelity | Since 1872 | 26 | 19 months, median | 33%, median |
| S&P Dow Jones Indices, via CNBC (2022) | Since the late 1920s | Not given | Almost 19 months on average | 38% on average |
| Edward Jones | Since 1946 | 12 | About 16 months on average | About 34% on average |
A fifth count, from Yardeni Research and cited by Investopedia, finds 22 bear markets since the 1929 crash, with an average length of about 11.4 months.
The decline column barely moves: every source lands between a third and two fifths. The length column runs from under 10 months to 19. That spread is the real story.
Why the counts disagree
The main reason is how each source splits a long slide into pieces. The Hartford Funds summary of Ned Davis data counts 12 separate bear markets between 1928 and 1945 alone. The Great Depression decline, for example, appears there as six distinct bears between 1929 and 1933, each with its own start and end date, because the index bounced enough in between to reset the clock.
Chop one long decline into six short ones and the average length falls fast. Count it as one decline from the 1929 peak to the 1932 trough, as many closing-basis lists do, and it becomes a single bear of almost three years. Same prices, different rule.
The second reason is the statistic itself. Fidelity reports medians, while Hartford and S&P report averages. A few very long bears pull an average up, so a median is usually the better guide to a typical one.
The third reason is the start date. Edward Jones begins in 1946 and so leaves out the 1930s, the most violent decade in the record. When you read "the average bear market lasts X months", the first question is whose rule, and since when.
How long bull markets last
The bull side shows the same pattern of agreement on direction and disagreement on size.
Ned Davis Research, through Hartford Funds, counts 28 bull markets since 1928, averaging 988 days, or about 2.7 years, with an average rise of 112%. Fidelity's count from 1872 finds 26 bull markets with a median length of 42 months, about 3.5 years, and a median rise of 87%. The Edward Jones study, which starts in 1946, puts the average bull at about five and a half years with a rise of about 192%.
The Edward Jones figure is the largest because its window excludes the short, broken rallies of the 1930s. The Ned Davis figure is the smallest because its rule ends a bull at every 20% drop, and there were many of those before the Second World War.
Time spent in each
The ratio matters more than any single average. Hartford's summary notes that, of the 95 years it covers, bear markets took up about 21.4. The other 78% or so of the time, the index was in a bull market or a correction inside one.
That is why the two words feel lopsided in practice. Most of the years an investor lives through are bull years, and the bear years arrive faster and hurt more per month.
The shortest bear and the most recent one
Two recent bear markets show how far apart the shapes can be.
The 2020 bear ran from February 19 to March 23, 33 days in total, and took the S&P 500 down 33.92%. It was the shortest bear market in the Ned Davis record and one of the steepest. A trader who blinked missed the whole thing.
The 2022 bear ran from January 3 to October 12, 282 days, with a decline of 25.43%. It was close to the long-run average in length and milder than average in depth. It also arrived without a recession, which surprised plenty of people who had learned the two words as a pair.
Then came 2025. On April 8, as CNN reported, the S&P 500 posted its lowest close of the year, down 18.9% from its February peak. Under every source in the table above, that was a correction, not a bear market. It shows up in no bear market count, even though it came within 1.1 percentage points of the line.
Why the label only arrives after the turn
Here is the part most explainers skip. Neither label can be applied on the day the market turns.
A bear market is only declared once the index is already 20% down. By then most of the decline has usually happened: the median bear in Fidelity's data fell 33%, so the official label arrives with well over half of the typical drop already behind it.
A bull market is worse. The rule says it begins at the closing low, but nobody knows a low was the low until the index has climbed 20% from it. The bull market that began at the October 12, 2022 low was only recognised months later, and then dated back to that day. Hartford's summary adds that about 36% of the S&P 500's strongest days between 2003 and March 2025 came in the first two months of a bull market, before it was clear one had begun.
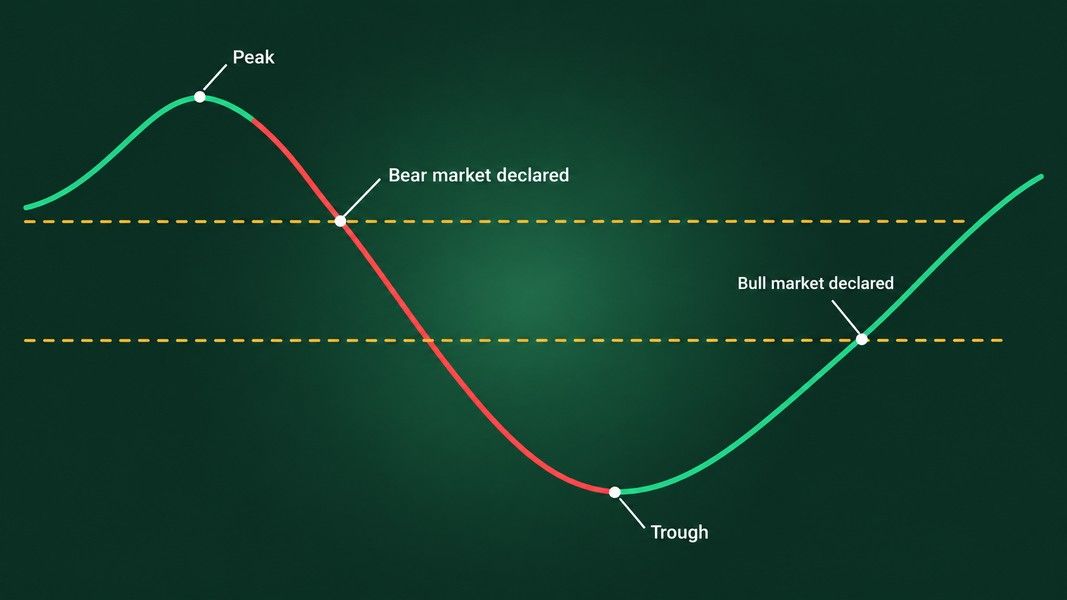
Both labels are history, not forecasts. They describe a stretch of the past once it can be measured, which is why the counts in the table above can be compiled at all, and why none of them tells you where today's market sits inside its own cycle.
Bear markets and recessions
The two words travel together in headlines, but the record is looser than that. Hartford's summary counts 27 bear markets since 1928 against only 15 recessions in the same period, using recession dates from the National Bureau of Economic Research.
According to Fidelity's comparison, about a quarter of bear markets came with no recession at all. The Crash of 1987 is the famous one: the S&P 500 fell about a third in a few months and the economy kept growing. The 2022 bear is the recent one.
Depth varies too. In the Edward Jones data, only three of the 12 bear markets since 1946 fell 40% or more. The deep, multi-year collapses that define the word for many people are the exception in the record, not the rule.
None of this means a bear market is mild. A 25% fall in an index can still mean far larger falls in single stocks, and the recovery to the old high can take years after the bottom.
What an index label means for one stock's chart
Bull and bear markets are labels for an index. A single stock can sit in its own downtrend while the S&P 500 climbs to records, or hold up through a bear market while the index falls a third. The label tells you about the average of 500 companies, not about the one on your screen.
That is where reading the individual chart comes in. Primo Trade's Analyze Chart takes a photo or screenshot of a stock chart and gives an AI read of the trend, volatility, volume and sentiment it sees, along with the chart pattern it recognises and what that pattern usually signals. From a ticker, the app also pulls the stock's prices, news and financial metrics into one AI analysis.
Primo Trade gives AI-generated analysis for information and education. It is not financial advice. Markets carry risk; do your own research before you trade.
The AI's read is a description of what one chart shows, so it has the same limit as the bull and bear labels: it describes the past and present of the chart, not what comes next. If you want the vocabulary behind the shapes it names, the guide to bullish and bearish chart patterns covers the common ones. If you use a moving-average crossover as your own trend filter, the post on the golden cross signal looks at what seven decades of those signals show.
What the numbers add up to
Bull markets have lasted longer than bear markets in every published count, from about 2.7 years against 9.6 months on the Ned Davis rule to about five and a half years against 16 months since 1946. The typical bear fell about a third, a figure the sources roughly agree on, while their lengths differ because each source splits long declines differently and starts in a different year.
The 20% line is a convention measured on closing prices, which is why April 2025 was a correction and 1990 was not a bear market at all. Both labels are applied after the threshold is crossed, so they mark history rather than the turn itself. And a bear market is a statement about an index, not about the economy and not about any one stock.