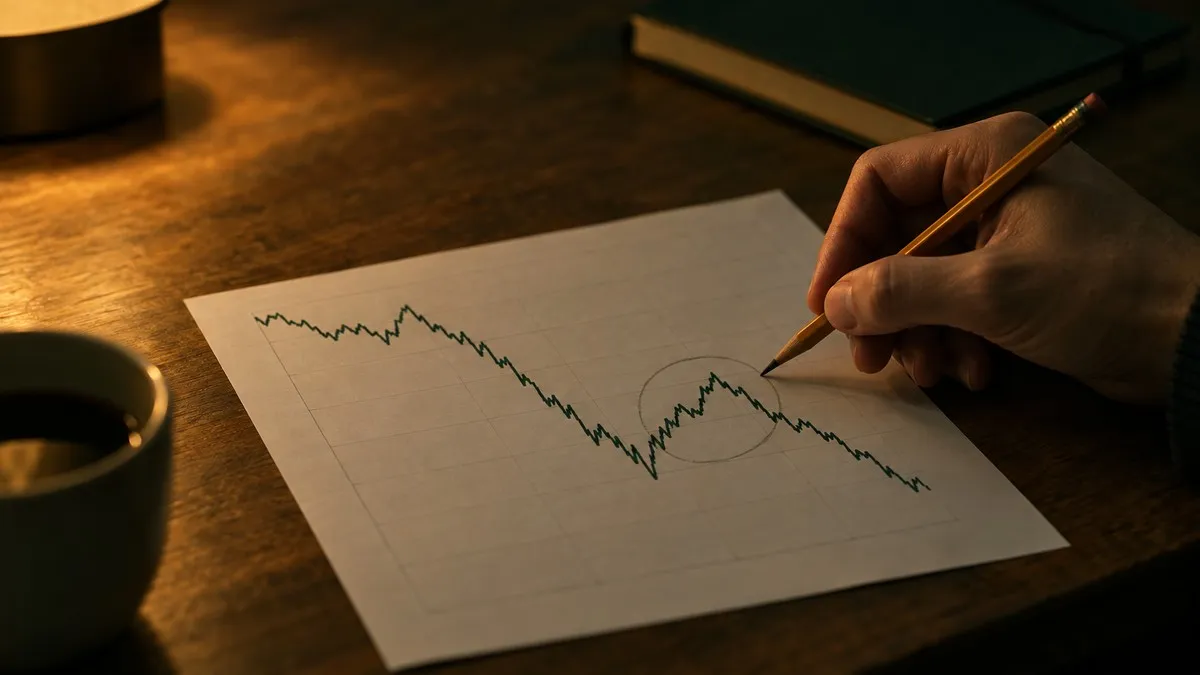
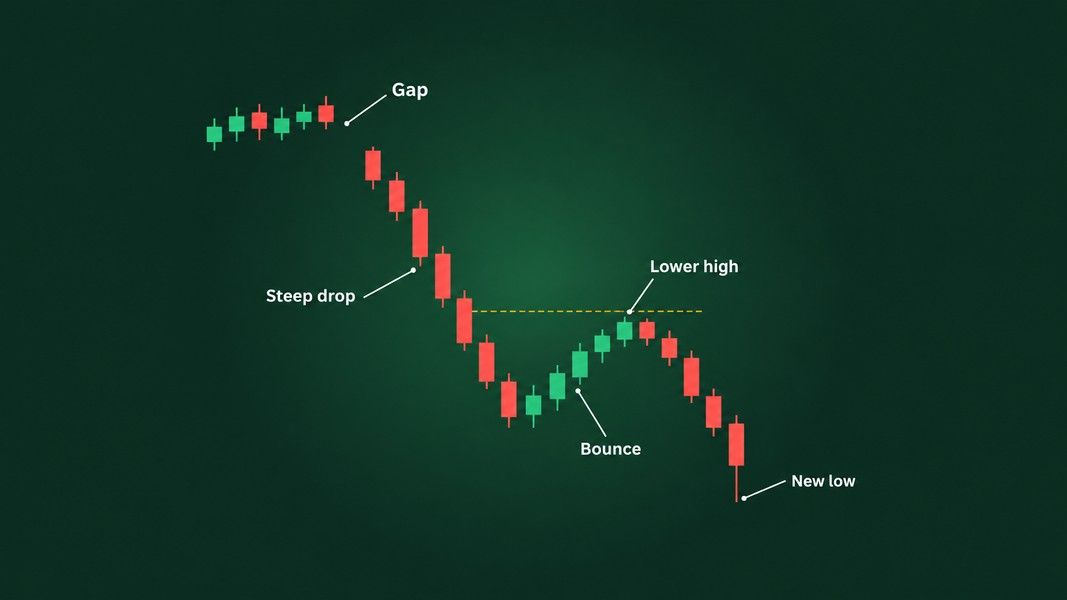
A dead cat bounce is a short rally after a steep fall that runs out of buyers and gives way to a new low. The name comes from an old trading-floor joke: even a dead cat bounces if it falls from high enough. The catch is that you only know a bounce was dead after the new low arrives.
Meta Platforms left a clean pair of examples on its 2022 chart. In March and April the stock rallied 25% off its low, then fell another 62%. In November it rallied by a similar amount off a lower low, and that rally turned into a recovery that nearly quadrupled the share price by the end of 2023. Same stock, same year, two bounces that looked alike while they were happening.
This post reads both after the fact, using daily closes from Yahoo Finance, and asks a narrow question: what could a chart reader have seen at the time, and what could nobody have seen?
What a dead cat bounce is, and what it is not
A dead cat bounce is not a pattern you spot in real time. It is a label you apply once the story has ended. While the rally is running, it is simply a rise inside a downtrend, and every recovery starts that way too.
The rough shape people describe has four parts. A steep fall comes first, often a gap on bad news. A rally then wins back part of the fall. The rally stalls below the level where the fall began, or below an old floor that broke on the way down. Then price turns lower and closes under the low the rally started from.
That last step is the whole definition, and it lies in the future when you are looking at the rally. No fixed size separates a dead bounce from a live one. A 10% rally can fail and a 40% rally can fail.
Rallies like this are common inside falling markets, which is one reason a bear market is hard to date while you are inside one. The numbers on how long bull and bear markets last show how long those stretches can run.
The drop that set it up: February 3, 2022
Meta reported its fourth quarter of 2021 after the close on February 2, 2022. Reuters reported that Facebook had lost daily users for the first time. The company forecast first-quarter revenue of $27 billion to $29 billion against the $30.15 billion analysts expected, and said Apple's iPhone privacy changes would cost it about $10 billion of revenue that year, according to CNBC's report from the day.
The stock closed at $323.00 on February 2 and at $237.76 on February 3, a fall of 26.4%. That single session erased more than $230 billion of market value, the company's worst one-day loss to that point. Volume was 188.1 million shares, more than three times the 58.5 million of the session before.
It did not stop there. Meta kept sliding through February and early March and closed at $186.63 on March 14, 42% below where it stood before the report.
Bounce one: March 14 to April 4, 2022
From that close of $186.63, Meta rose to $233.89 on April 4, a rally of 25.3% in 15 sessions. The stock added a quarter to its price in three weeks. On the chart it looked like the low was in.
What the chart showed during the rally
Three things stood out, and none of them needed hindsight.
The volume was thin. Daily volume during the rally ranged from 19.5 million to 52.1 million shares. The busiest day of the rally traded less than a third of the drop day's 188.1 million.
The rally stopped under the gap. The April 4 close of $233.89 sat just below the February 3 close of $237.76, the bottom edge of the gap. The space between $237.76 and $323.00 stayed empty. Old floors often turn into ceilings, and the post on where price turns covers why that happens less neatly than textbooks suggest.
Nothing had changed about the reason for the fall. The users, the Apple changes and the weak forecast were all still the story, and the next earnings report was weeks away.
What followed
On April 22, Meta closed at $184.11, below the March low. That close is the moment the March rally earned its label. By April 27 it was at $174.95.
The next day, after first-quarter results, the stock jumped 17.6% to $205.73 on 100.9 million shares. That bounce faded too. After third-quarter results in late October, the stock fell about 25% in a day to $97.94, which CNBC noted was its lowest price since 2016. On November 3, 2022, Meta closed at $88.91. That was 62.0% below the April 4 top of the first bounce and 72.5% below the close before the February report.
Bounce two: November 3 to December 2, 2022
The second rally started from that $88.91 close. On November 9, Meta said it would cut more than 11,000 jobs, about 13% of its workforce, as Reuters reported that day. The stock rose 5.2% to $101.47 on 107.7 million shares.
By November 23 it had closed at $112.24, up 26.2% from the low, almost the same size as the spring rally. By December 2 it was at $123.49, up 38.9%. Then it slipped back to $113.93 on December 7.
What followed
This time no lower low came. Meta ended 2022 at $120.34. On January 6, 2023, it closed at $130.02, above the $129.82 close from before the October drop, so the October gap was filled. On February 1, 2023, the company reported fourth-quarter results, called 2023 its "Year of Efficiency" and added $40 billion to its share buyback, Reuters wrote. The next day the stock closed at $188.77, up 23.3%, on 150.5 million shares.
On the last session of 2023, Meta closed at $353.96, nearly four times the November low and above the $323.00 close from before the February 2022 report.
Both rallies side by side
Here is what each rally looked like with only the information available while it ran.
| Spring 2022 rally | Autumn 2022 rally | |
|---|---|---|
| Low it started from | $186.63, March 14 | $88.91, November 3 |
| Size in the first weeks | +25.3% to April 4 | +26.2% to November 23 |
| Busiest volume day of the rally | 52.1 million shares | 107.7 million shares |
| Drop day volume before it | 188.1 million shares | 232.3 million shares |
| Gap above the rally | Never filled in 2022 | Filled on January 6, 2023 |
| News during the rally | Nothing that changed the cause | 11,000 job cuts on November 9 |
| What came next | New low on April 22 | No new low; $353.96 at the end of 2023 |
Which signs told them apart
The volume reads differently. The spring rally's busiest day was under a third of the drop day. The autumn rally's busiest day was close to half of its drop day's 232.3 million, and it came on news.
The gap test did not separate them for weeks. At its December 2 high of $123.49, the autumn rally was still below the $129.82 gap edge, just as the spring rally stalled below its gap. Anyone using that sign alone would have read both rallies the same way through the end of 2022.
The news test did separate them. The spring rally ran on nothing new. The autumn rally carried a direct answer to what investors had punished in October, which was spending. Even that was not clean at the time: Reuters framed the job cuts as Meta doubling down on its metaverse bet, which was the very spending the market disliked.
The honest read is that the second rally had a better case while it ran, not a settled one.
Why no one can call a dead cat bounce in real time
The definition needs a lower low, and the lower low is in the future. On December 2, 2022, a reader looking at a stock up 39% in a month, still under its gap, after a year of failed rallies, had every reason to suspect another dead cat. That reader would have been wrong.
The reverse is also true. On April 4, 2022, a reader could have pointed to a 25% rally and a stock down far from its high and called it a bottom. That reader would have watched it fall another 62%.
So the signs above are not a test that sorts bounces. They shift the weight of evidence. A more useful habit is to decide before the rally runs which close would tell you the fall has resumed. For the spring rally, a close below the March low of $186.63 was that line, and it came on April 22. For the autumn rally, the same line sat at $88.91, and it was never touched again.
Three questions to ask of any bounce
- Is volume on the rally days heavier or lighter than on the days of the fall?
- Has the rally reached the level where the fall began, or the edge of the gap, or has it stalled below it?
- Has anything changed about the reason the stock fell, or is the rally running on no news at all?
None of these questions has an answer that settles the matter. Each one tells you how much weight to put on the rally while you wait for the chart to decide.
Getting a second read on a bounce
Those three questions are about the chart and the news, which is what Primo Trade reads. Take a photo or a screenshot of a chart like Meta's in spring 2022, and the AI reads the trend, volatility, volume and sentiment, names the chart pattern it sees and what that pattern usually signals. Search a US ticker instead, and the analysis also lists recent news with dates, the place to check whether anything changed about the reason for the fall.
The result carries a signal, from Strong Buy to Strong Sell, as the AI's read of what it sees, not an answer to the question no one can answer in real time. Primo Trade gives AI-generated analysis for information and education. It is not financial advice. Markets carry risk; do your own research before you trade.
What Meta's two rallies show
A dead cat bounce is a rally that ends in a lower low, and that ending is the only thing that makes it one. Meta's 2022 chart holds two rallies of about 25% within eight months: one closed below its starting low less than three weeks after its top, the other started a recovery that nearly quadrupled the stock.
While they ran, the spring rally had thin volume, a stall under the gap and no new information. The autumn rally had heavier volume and a direct response to the cause of the fall, but it also stalled under its gap for weeks. The signs leaned one way in spring and the other in autumn, and neither settled the question until the chart did.
The practical lesson is to treat any rally after a steep fall as unproven, to know in advance which close would prove it failed, and to look at the reason for the fall as closely as at the shape of the bounce.