
You look up Apple's debt to equity ratio and one site says 1.34. Another says 3.87. Neither is a typo. Both come from the same balance sheet, dated September 27, 2025, and the whole gap comes down to one choice: what goes on top of the fraction.
The debt to equity ratio divides what a company owes by what its shareholders own on paper. A ratio of 1.0 means one dollar of debt for every dollar of book equity. This guide works through the calculation on Apple's real filing, shows where the two versions split, and covers the cases where the number stops meaning anything, such as a company with negative equity.
What you'll need
Three things, all free. First, the company's latest annual report (Form 10-K) or quarterly report (Form 10-Q). Every US-listed company files them with the SEC, and the balance sheet sits near the front of the financial statements.
Second, a calculator. Third, ten minutes and some patience with line items, because the totals you need are not always printed where you expect them.
You don't need a finance degree. You need to know which two lines to pick, and that is most of what this post is about.
The debt to equity ratio formula, in two versions
The SEC's own beginners' guide writes the formula like this:
Debt to equity ratio = Total liabilities / Shareholders' equity
Most data sites and many analysts use a narrower version:
Debt to equity ratio = Total debt / Shareholders' equity
Total liabilities is everything the company owes: bills to suppliers, taxes due, money customers paid for things not yet delivered, and borrowed money. Total debt keeps only the borrowed money: bonds, notes, commercial paper and, depending on who is counting, leases.
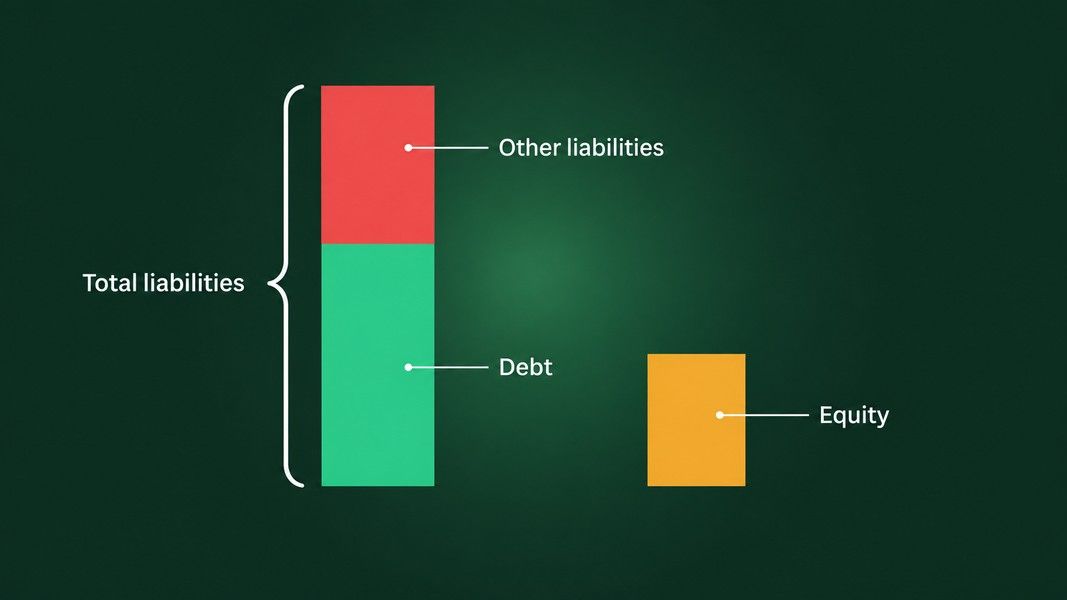
Neither formula is wrong. The two numbers are simply not comparable, so the first question to ask about any D/E figure you read is which one it is. The SEC guide puts the meaning plainly: a ratio of 2 to 1 means the company has two dollars of debt for every dollar its shareholders have put in.
How to calculate debt to equity ratio, step by step
Here is the full calculation on Apple's balance sheet for the fiscal year ended September 27, 2025. All figures are in millions of dollars.
Step 1: open the balance sheet
In a 10-K it is usually titled "Consolidated Balance Sheets". Apple's is on page 31 of its fiscal 2025 10-K. There are two columns, this year and last year. Start with the newer one.
Step 2: find total shareholders' equity
It is the last subtotal before the grand total at the bottom. For Apple: $73,733 million.
Step 3: choose your numerator
For the SEC version, take total liabilities: $285,508 million.
For the debt-only version, add up every line that is borrowed money. Apple has three: commercial paper of $7,979 million, current term debt of $12,350 million and non-current term debt of $78,328 million. Together that is $98,657 million. Everything else under liabilities, from accounts payable to deferred revenue, stays out.
Step 4: divide
| Version | Numerator | Equity | D/E |
|---|---|---|---|
| Total liabilities | 285,508 | 73,733 | 3.87 |
| Debt only | 98,657 | 73,733 | 1.34 |
Apple, balance sheet as of September 27, 2025, in millions of dollars.
That is the 1.34 versus 3.87 from the opening. The same company, on the same day, is either moderately or heavily indebted depending on a formula choice nobody on the page told you about.
Step 5: compare it with last year
The same filing carries the prior year, September 28, 2024. Total liabilities were $308,030 million against equity of $56,950 million, a ratio of 5.41. Debt was $106,629 million, a ratio of 1.87.
Both versions fell in a year. Part of that is debt: it shrank by about $8 billion. The bigger part is equity, which grew by $16.8 billion. Apple's net income of $112.0 billion was more than the $90.1 billion it spent buying back shares plus $15.4 billion of dividends, and share-based pay added to paid-in capital. A falling ratio can mean less debt or more equity, and only the balance sheet tells you which.
What is a good debt to equity ratio?
There isn't one number. The SEC guide says it directly: desirable ratios vary by industry. A software company and a power utility are built differently, and their balance sheets show it.
Aswath Damodaran at NYU Stern publishes an industry debt dataset for US companies every January. It reports debt to capital, which is debt divided by debt plus equity, rather than D/E itself. The conversion is simple: a debt to capital of 50% equals a D/E of 1.0.
| Industry | Firms | Book debt to capital | Market D/E |
|---|---|---|---|
| Semiconductor | 66 | 25.54% | 2.58% |
| Software (System & Application) | 309 | 34.14% | 5.67% |
| Utility (General) | 14 | 57.87% | 75.88% |
| Air Transport | 23 | 71.38% | 87.76% |
| Bank (Money Center) | 15 | 72.69% | 164.05% |
| Restaurant/Dining | 64 | 95.29% | 27.05% |
| Total market without financials | 4,822 | 48.24% | 17.14% |
Damodaran, US companies, data as of January 2026, unadjusted for leases.
Book value versus market value
Book and market figures tell different stories, because market D/E uses the stock market's value of equity instead of the balance sheet's. A richly valued software company looks almost debt-free on that measure.
Restaurants are the odd row at 95% book debt to capital. That is not because they all borrowed far more than airlines. It is because the equity under the line has shrunk close to nothing, which brings us to the case where the ratio breaks.
When the ratio breaks: negative equity
McDonald's reported total shareholders' equity of minus $1,791 million at December 31, 2025, against long-term debt of $39,973 million, according to its annual report. A year earlier the deficit was $3,797 million.
Divide debt by a negative number and you get a negative ratio, which would read as "less than no debt". That is nonsense. The company carries about $40 billion of debt either way.
Equity is not a measure of what a business is worth. It is an accounting balance: what owners put in, plus income kept over the years, minus what was paid back out. Apple's statement of shareholders' equity shows this line by line, with $90,052 million of repurchased stock subtracted in fiscal 2025 alone. A company that hands back more than its book equity can end up below zero while still running a large, busy business.
When equity is negative or tiny, stop using D/E. Look at debt against cash flow instead. Damodaran's dataset lists debt to EBITDA and interest coverage for every industry for exactly that reason.
Leases: debt by another name
Look at the McDonald's balance sheet again and there is a second large line: a long-term lease liability of $14,147 million, sitting beside the $39,973 million of long-term debt. Count it and the numerator grows by about a third.
Whether to count it is a judgment call. Damodaran's paper on leases and debt argues that a lease commitment is debt in substance, and that leaving it out makes debt ratios look lower than they are. That is why his dataset carries a column with leases and one without.
For your own calculation, the rule is consistency. Pick one treatment and use it for every company you compare, and for every year of the same company.
Banks and insurers play by different rules
Money center banks show a market D/E of 164.05% in the same dataset, and non-bank financial services 272.33%. That does not make every bank fragile. For a bank, borrowing is the product: customer deposits are liabilities, and lending them out is the business.
So a bank's D/E only means something next to other banks. Put a bank's ratio beside a software company's and you learn nothing except that they are different kinds of company.
Where an AI read fits
Primo Trade's ticker analysis pulls a company's prices, news and financial metrics into one AI read, and part of the result is a Fundamental score from 0 to 100 on the Primo Score radar. A score is a summary. When it surprises you, the balance sheet is where you go to see why, and a D/E you calculated yourself tells you exactly which formula you're looking at.
Primo Trade gives AI-generated analysis for information and education. It is not financial advice. Markets carry risk; do your own research before you trade.
A chart is a different input. When Primo Trade reads a photo of a chart, it sees trend, volume and pattern, never the debt behind them, which is one of the limits covered in how AI reads a stock chart. The tools covered in AI stock analysis tools compared differ in the same way: some read the filings, some only the price.
When your number does not match the website's
You will hit this often. Before assuming one of you made a mistake, check the usual suspects:
- Numerator: total liabilities or borrowed money only. This alone moved Apple from 1.34 to 3.87.
- Leases: in the numerator or out of it.
- Date: the last annual report, the last quarter, or a figure that has not been refreshed since either.
- Equity: book value from the balance sheet, or market value from the share price.
Most mismatches are one of these four. If yours still differs after checking all of them, open the filing and add the lines again; it takes two minutes and settles it.
The short version
The debt to equity ratio is debt divided by shareholders' equity, both taken from the balance sheet. The SEC's version puts total liabilities on top, while most data sites use borrowed money only, and on Apple's September 2025 balance sheet that choice alone is the difference between 3.87 and 1.34.
Read the number against the company's own industry and its own history, not against a universal threshold. Check whether a change came from debt or from equity. Treat leases the same way every time. When equity is negative, as at McDonald's, set the ratio aside and look at debt against cash flow.