On January 12, 2021, GameStop closed at $19.95. On January 27 it closed at $347.51. The story most people still tell about those two weeks is simple: Reddit traders found a stock that hedge funds had shorted, bought it, and forced the short sellers to buy it back at any price. That is the GameStop short squeeze as legend.
The regulator's version is messier. In October 2021 the SEC published a staff report on that January, and several of the most repeated claims did not survive it. This post reads the window from mid-January to late February 2021 after the fact: what the chart showed, what the data later showed, and what nobody watching at the time could have known. It is history, not a view on the stock today.
What a short squeeze is, in one paragraph
A short seller borrows shares, sells them, and hopes to buy them back cheaper later. If the price rises instead, the loss grows with every dollar, and at some point the short seller buys shares to close the position, which is called covering. A short squeeze is what happens when that forced buying pushes the price higher still, which forces more short sellers to cover. It feeds on itself until the shorts are gone or the buying runs out.
The short squeeze meaning is about who is buying and why, and that is exactly the part a price chart cannot show you. Keep that in mind, because it is the thread through every myth below.
One housekeeping note: GameStop split its stock four for one in July 2022, according to the company's split announcement. Every price in this post is the price people saw in 2021. A chart you open today shows them divided by four, so that $347.51 close appears as about $86.88.
The January 2021 run in numbers
Interest had been building for over a year. GameStop was discussed on Reddit in 2019, and the SEC report notes that its short interest was already being pointed out there in April 2020. Then the dates stack up quickly:
| Date (2021) | What happened |
|---|---|
| January 11 | GameStop names Chewy co-founder Ryan Cohen to its board; intraday high of $20.65 |
| January 13 | Close of $31.40, up from $19.95 the day before, on a jump in volume |
| January 26 to 27 | The close rises by $199.53 in one session, to $347.51 |
| January 28 | Several brokers restrict buying; the stock closes at $193.60, a $153.91 fall |
| February 19 | Low of $40.59 |
The figures come from the SEC's staff report, apart from the January 28 close, which CNBC reported on the day as a 44.3% drop with trading halted several times. Measured from the intraday low on January 8 to the intraday high on January 28, the stock rose about 2,700%. From that high it then fell more than 86% by the close at the end of the first week of February.
That is the shape everyone remembers. Now the myths.
Myth 1: short sellers buying back drove the GameStop short squeeze
This is the heart of the legend, and the SEC staff did not find it in the data. They saw short covering, but not as the engine.
The staff identified traders holding large short positions in GameStop and tracked their buying in half-hour slices from January 19 to February 5. During some discrete periods, sharp price jumps lined up with known short sellers closing out after heavy losses, and the report says that covering likely added to those jumps. But that buying was a small fraction of overall buy volume, and the price stayed high after the covering was done.
The staff's conclusion, in the words academics later quoted back at them, was that "it was the positive sentiment, not the buying-to-cover, that sustained the weeks-long price appreciation of GameStop stock." In other words, the crowd buying because it believed in the trade, or in the fight, did more of the lifting than the shorts running for the exit.
So was it a short squeeze at all? Partly, in bursts. The rest was a buying frenzy that happened to have a heavily shorted stock at its centre.
Myth 2: options dealers caused a gamma squeeze
The second popular explanation is a gamma squeeze. When traders buy lots of call options, the market makers who sell those calls often buy the stock to hedge. If the stock rises, they need to buy more, and that buying pushes the price higher again.
The ingredients were there. Trading in January 2021 was concentrated heavily in call options, many of them short-dated, and implied volatility rose dramatically. The report agrees that, in theory, all those written calls could have added fuel.
The staff still did not find evidence of a gamma squeeze in GameStop during January 2021, in the data available to them. That last clause matters, and it is where the story is not fully settled.
Where the experts still disagree
In 2022 a group of finance professors published a response through an ad hoc committee on SSRN. Extending the sample and adding securities lending data, they found evidence that a nontrivial fraction of GameStop volume was short sellers covering, and they argued the gamma analysis should include hedging by put and call market makers alike.
They were also candid about their own limit. Without the nonpublic, account-level data the SEC holds, they could not pin down how big either squeeze was, let alone who was behind it.
That is the honest state of things. The official reading says sentiment did most of the work; a serious academic reading says the squeezes may have been larger than the official one found. Neither side can show you the exact split, and anyone who claims certainty here is selling a story.
Myth 3: short interest over 100% proves fake shares
GameStop's short interest was extreme. Through most of 2020 it hovered around 100% of shares outstanding, peaking at 109.26% on December 31, 2020, and the SEC report puts January 2021 short interest at 122.97% of the float. Other meme stocks of the month were far lower: 77.3% for Dillard's, 66.02% for Bed Bath & Beyond.
A number above 100% sounds impossible, and it fed a long-lived theory about counterfeit shares. The report explains the arithmetic instead. Short interest can exceed 100% when the same shares are lent more than once. One holder lends a share to a short seller, who sells it; the buyer then lends that same share out again, and the share is now counted as sold short twice.
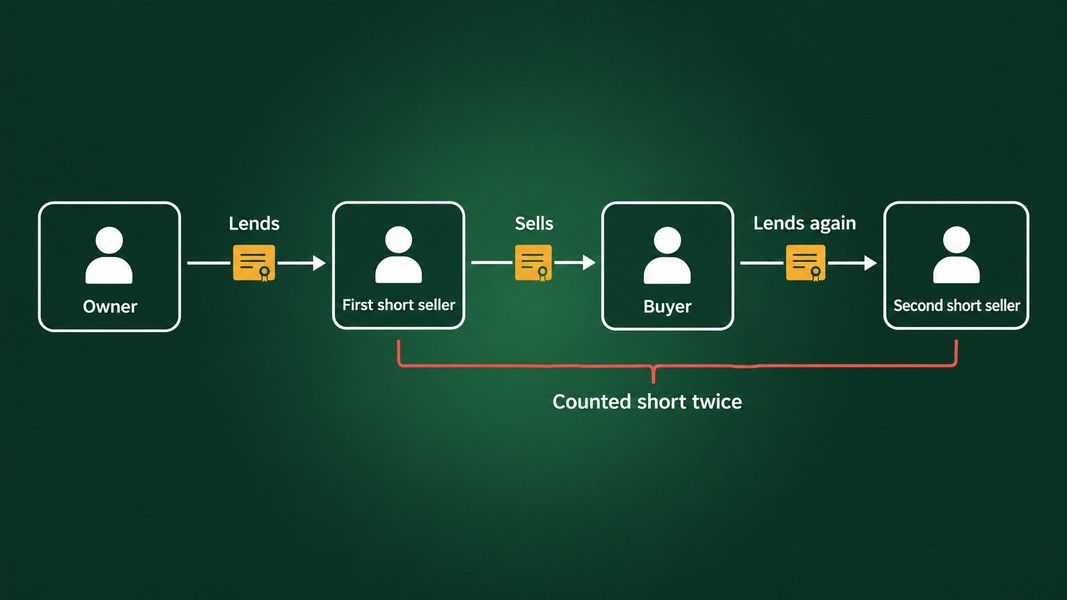
A high number does mean a crowded trade, and crowded shorts are fragile. It does not, on its own, mean anyone invented shares.
Myth 4: Robinhood stopped buying to protect hedge funds
On January 28, Robinhood, Interactive Brokers and others limited some customers to selling GameStop and other names, not buying. The timing, at the top of the move, made it look like a rescue for the short sellers, and that suspicion ran all the way to a Congressional hearing.
The explanation that came out was about plumbing. Every US stock trade then took two days to settle, and during that window the clearinghouse, the NSCC, demands a deposit from each broker to cover the risk of a member failing. The deposit grows with volatility and with concentration in a few stocks.
Robinhood CEO Vlad Tenev said his team got a request from the NSCC at 3:30 a.m. Pacific time that Thursday for a deposit of about $3 billion, which he called an order of magnitude more than usual. The requirement was later cut to around $1.4 billion, and the company raised $1 billion in emergency capital from existing investors. At the hearing, Tenev testified that the limits were not imposed at the request of hedge funds or to move the price.
Robinhood's own SEC filing later counted about 50 putative class actions over the restrictions. Whatever you make of the decision, the documented trigger was a collateral call, and it was not visible to anyone looking at a chart.
Myth 5: nothing like GameStop had ever happened
GameStop felt unique because it was famous. The SEC staff checked, and its moves were not even the biggest of that week.
On January 27, Koss rose 480.0% from the previous close, AMC 301.2% and Naked Brand 252.3%, each a larger one-day change than any GameStop managed. Since the start of 2020, 134 common stocks had at least one single-day rise bigger than GameStop's largest. More than 100 stocks saw outsized price moves or volume in January 2021 alone.
What made GameStop different was the attention, not the size of a single day.
Myth 6: when it was over, the stock went back to where it started
The crash after January 28 was brutal, but the round trip people imagine never happened in that window. By February 3 the price was below $100, and it fell as low as $40.59 on February 19. That low was still well above where the stock closed on January 4.
The report adds that the price climbed back above $100 at the end of February and stayed above that level through the time it was written. That is a statement about 2021 and nothing more. It tells you nothing about the stock since, and nothing about what the next crowded short will do.
What the chart showed, and what it could not
Put yourself in front of a GameStop chart on January 27, 2021. You would have seen a near-vertical run, gaps between sessions, and volume many times its usual level. The market was also showing strain that the SEC measured later: on January 28 the average relative effective spread was 0.54%, three times the 2020 average, quoted spreads were nearly 50 times wider than usual, and short sale circuit breakers tripped on January 15 and January 28.
You could not have seen who was buying, how much of it was short covering, what options dealers were doing, or that a clearinghouse would ask one broker for billions before the market opened. A chart records the result of all those decisions, never the decisions themselves. If a falling price can blow through an order, as our guide to stop-loss orders explains, a day like January 28 shows how far the gap between two prints can stretch.
Where an AI chart read stops
The same limit applies to any tool that reads a chart, including the AI. Primo Trade reads a chart photo for trend, volatility, volume and sentiment, and names the pattern it sees and what that pattern usually signals. On a chart like this one, that read would cover the shape on the screen and nothing about the clearing calls or the order flow behind it. We have written about where AI chart reading falls short, and a squeeze is a textbook case. For a US-listed stock, Primo Trade can also run a ticker analysis with recent news and financial metrics beside the chart, which adds context but still not the order book.
Primo Trade gives AI-generated analysis for information and education. It is not financial advice. Markets carry risk; do your own research before you trade.
How to read the next short squeeze headline
Reddit short squeeze threads did not end in 2021, and the same claims come back with every new crowded stock. A few questions from the GameStop record help sort them:
- Who is actually buying? Short covering, crowd buying and options hedging can all push a price up, and the SEC found the crowd did most of it in GameStop. A headline that names only one is guessing.
- What does the short interest figure count? Above 100% means shares lent more than once and a crowded trade, not proof of fraud.
- What could stop the buying? In 2021 it was a clearing deposit, not a market signal. Settlement, margin and broker risk rules can change a stock's path overnight.
- Is the comparison honest? Plenty of stocks moved more in a day than GameStop did. Fame is not size.
The bottom line
The GameStop short squeeze was real in bursts, but the SEC staff found that crowd sentiment, not short sellers buying back, carried most of the rise, and found no gamma squeeze in the data it had. Academics pushed back with evidence that covering and options hedging may have mattered more, and neither side can settle the split from public data.
Short interest over 100% came from shares lent more than once. The buying limits on January 28 traced back to a clearinghouse deposit call that no chart could show. GameStop's biggest day was not even the biggest of its week. Read with hindsight, the clearest lesson is about the edge of what a price chart can tell you: it shows what happened, never who made it happen or what was about to change behind the screen.