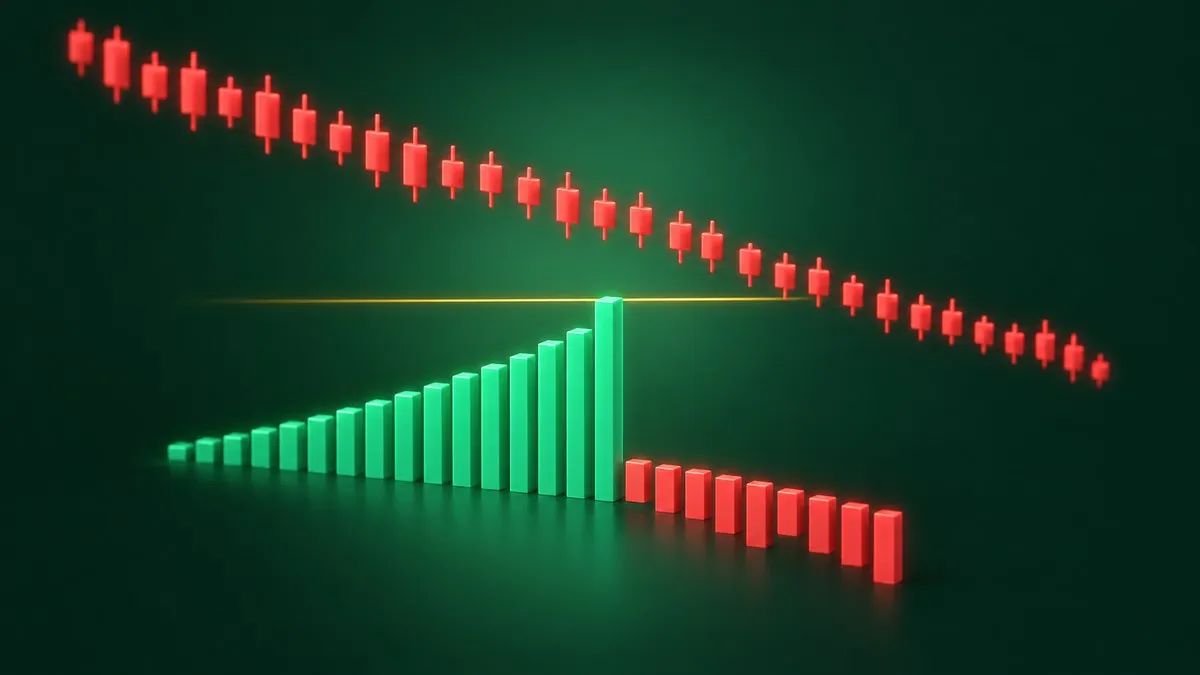
You sort a screener by the lowest PE ratio, and a well-known chip maker sits near the top at about 7. It looks like the market forgot to price it. That was Micron in September 2022, and its next fiscal year ended in a $5.83 billion loss.
The PE ratio, short for price to earnings, is the share price divided by a year of earnings per share. It tells you how many dollars investors pay for one dollar of a company's annual earnings. There is no single good PE ratio: the number means something only next to the same company's history, its sector and the direction its earnings are heading.
That last sentence is where most PE mistakes start. Below are five beliefs about the ratio that sound sensible, and the numbers that break each one.
What the PE Ratio Actually Measures
The SEC's investor education site, Investor.gov, defines it plainly: divide the current share price by the current earnings per share, where earnings per share are the past 12 months of earnings divided by the shares outstanding. It is a way of gauging whether a price is high or low compared with the past or with other companies.
The arithmetic is short. A stock at $50 with $2.50 of earnings per share over the last year has a PE ratio of 20. Investors are paying 20 times one year of earnings for a share.
The ratio has two moving parts, and most myths come from watching only the price. Earnings change every quarter, and the ratio moves when they do, even if the price sits still. Earnings per share is also less tidy than it looks; one quarter can produce three different figures, as our post on earnings per share walks through.
Myth 1: A PE Ratio Under 15 Means a Stock Is Cheap
The number 15 gets passed around as a dividing line. Charles Schwab's guide notes that readings below 15 are commonly called low and those above 30 high, then adds the part people skip: there is no universal standard, and the readings only mean something in context.
Context starts with the sector. Here are forward PE ratios for parts of the S&P 500 as FactSet's weekly Earnings Insight reported them on October 30, 2026:
| Group | Forward 12-month PE |
|---|---|
| Consumer Discretionary | 23.8 |
| Consumer Staples | 22.9 |
| Industrials | 22.8 |
| S&P 500 | 18.7 |
| Financials | 14.9 |
| Energy | 13.2 |
An energy company at 14 sits above its sector's figure. A consumer staples company at 14 sits far below its own. Same number, opposite readings.
What to compare it with instead
Compare a stock's PE with its own history and with direct peers, not with a round number. Schwab makes the same point inside a single sector: semiconductor companies often carry a much higher average PE than computer hardware makers, although both sit in technology.
A PE ratio is a relative number, and 15 is a habit, not a benchmark.
Myth 2: A Low PE Ratio Is Always a Bargain
Back to Micron. Its trailing PE was 12.6 at the end of the quarter on December 2, 2021, and 11.1 at the end of the quarter on March 3, 2022, per StockAnalysis figures compiled by StockTitan. In between, on January 14, 2022, the stock set a closing high of $97.36.
By September 26, 2022 it had closed at $48.88, down 49.8%. The trailing PE at the quarter end of September 1, 2022 was 7.3. The stock looked cheaper every month it fell.
Why the ratio looked cheapest at the top
Memory chip earnings rise and fall with memory prices. In fiscal 2022 Micron reported diluted earnings of $7.75 a share, the peak year of that cycle. The PE was low because the earnings underneath it were at a high.
Then the earnings moved. In fiscal 2023 Micron's revenue fell 49.5%, its gross margin for the year was negative 9.1%, and it lost $5.83 billion. The share price had started falling while the most recently reported gross margin was still above 46%; the collapse showed up only in the reports that followed.
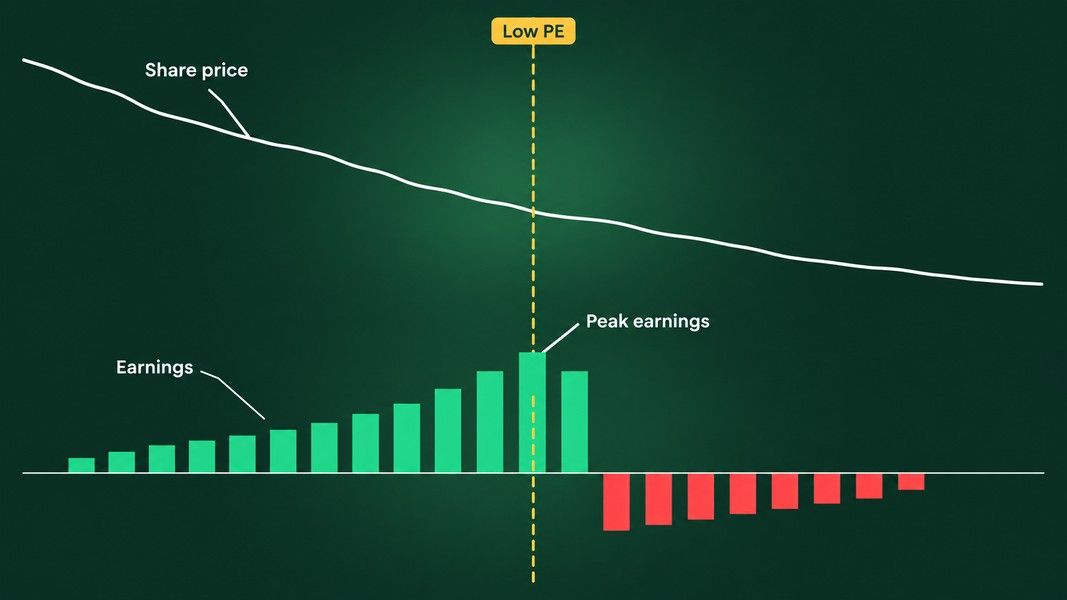
For a cyclical company, a low PE can mean earnings are near a peak, not that the stock is underpriced. Schwab says the same in general terms: a cyclical company's PE may fall significantly during an expansion, when earnings and margins tend to rise.
The name for this is a value trap
A stock that looks cheap on a ratio and keeps getting cheaper is called a value trap. The low PE was real; the earnings behind it were temporary. Energy, at the bottom of the table above, is a sector to read the same way: FactSet tied part of its earnings growth in the third quarter of 2026 to an average oil price of $85.68, 32% above the year before.
Myth 3: A High PE Ratio Means a Stock Is Overpriced
This is the mirror image of myth 2. A high PE says investors pay a lot for today's earnings. It says nothing yet about next year's.
Nvidia shows the arithmetic. Its diluted earnings per share were $0.17 for the fiscal year ended January 29, 2023, and $1.19 for the year ended January 28, 2024, adjusted for its 2024 stock split, per Fiscal.ai's income statement data. Earnings per share grew seven times in one year. A share price that stood still through that year would have seen its trailing PE fall to a seventh of where it started.
When earnings grow fast, a high trailing PE can shrink without the price falling at all. The whole market showed a milder version in October 2026: Forbes reported that the S&P 500's forward PE had dropped to 19.1 while the index sat near record highs, because earnings grew much faster than prices.
The PEG ratio puts growth back in
Peter Lynch wrote in One Up on Wall Street that the PE of any company that is fairly priced will equal its growth rate. That idea is the PEG ratio: the PE divided by the annual earnings growth rate. In Schwab's example, a forward PE of 20 with 10% expected earnings growth gives a PEG of 2.
PEG has its own weak spot. It leans on a growth estimate, and estimates change. A high PE is a question about growth, not a verdict on the price.
Myth 4: Every Stock Has One PE Ratio
Look up the same stock on three sites and you may get three PE ratios. None of them has to be wrong; they divide by different earnings.
Trailing PE uses the last 12 months of reported earnings. Forward PE uses analysts' estimates for the next 12 months. An adjusted PE swaps reported earnings for the company's own non-GAAP figure, which usually leaves out costs the company calls one-time.
Here is how far apart those readings sat for the same index within one week:
| Measure for the S&P 500 | Reading | Comparison |
|---|---|---|
| Forward 12-month PE, FactSet, Oct 30, 2026 | 18.7 | 10-year average 19.1 |
| Trailing 12-month PE, FactSet, Oct 30, 2026 | 25.9 | 10-year average 23.7 |
| Shiller PE (CAPE), Multpl, Nov 6, 2026 | 38.91 | Historical mean 17.45 |
Same market, three readings: below its average on the first, above it on the second, and more than double it on the third.
Why the gaps exist
Forward PE comes out lower when analysts expect earnings to grow, and it is only as good as those estimates. Adjusted earnings have their critics too. FactSet notes that there is no industry-standard definition of non-GAAP EPS, and that companies can use the gap to exclude items that more often than not would have lowered earnings.
The Shiller PE divides the price by ten years of inflation-adjusted earnings, which smooths out exactly the boom and bust that fooled the Micron reading. Its record is 44.19, set in December 1999.
Before comparing two PE ratios, check that both divide by the same kind of earnings.
Myth 5: The PE Ratio Works for Every Company
A company that lost money has no meaningful PE. Schwab notes that when a company has no earnings or a net loss, its PE is usually listed as N/A, and that the negative PE ratios some websites show are not useful for valuation.
Micron again: after its fiscal 2023 loss, its trailing PE stopped being a number worth reading at all. The ratio that had looked so cheap a year earlier now said nothing.
For loss-making companies, investors tend to switch to price to sales, which compares the price with revenue instead of earnings, or to cash measures. Our explainer on the free cash flow formula shows why cash and earnings can tell different stories about the same quarter.
A missing PE is not a warning or a bargain on its own; it means this tool does not fit this company right now.
How to Read a PE Ratio Without Falling for the Myths
Five questions do most of the work, and each one answers a myth above:
- Which PE is it? Trailing, forward or adjusted, and measured on which date.
- What do direct peers trade at? In the table above, sectors sat five points or more either side of the index.
- What is the stock's own range? Compare it with its own readings over several years.
- Where are earnings in their cycle? A low PE on peak earnings can be a trap, as Micron's 2022 reading showed.
- How fast are earnings growing? A high PE on fast-growing earnings can shrink quickly, as Nvidia's did.
Where an AI read fits
Answering those questions for one stock means pulling prices, earnings and ratios from several pages. Primo Trade does part of that from a ticker: it pulls prices, news and financial metrics for a US-listed stock and runs one AI analysis over them. The result includes a Primo Score with a Fundamental score from 0 to 100, and Key Insights tagged fundamental when the AI sees something in the numbers worth flagging.
Treat that score as the AI's read of the data, not a verdict. A Fundamental score of 80 is not an 80% chance of anything, and the AI cannot know whether this year's earnings are a cyclical peak any better than the PE can. Primo Trade gives AI-generated analysis for information and education. It is not financial advice. Markets carry risk; do your own research before you trade.
The Short Version
The PE ratio is price divided by a year of earnings per share, and it is only as useful as the earnings underneath it. Under 15 is not automatically cheap, and over 30 is not automatically expensive.
A low PE on peak earnings, as Micron showed in 2022, can come right before a loss. A high PE on fast-growing earnings, as Nvidia showed, can fall without the price moving. Check which PE you are reading, compare it with the sector and the stock's own past, and ask where its earnings sit in their cycle.