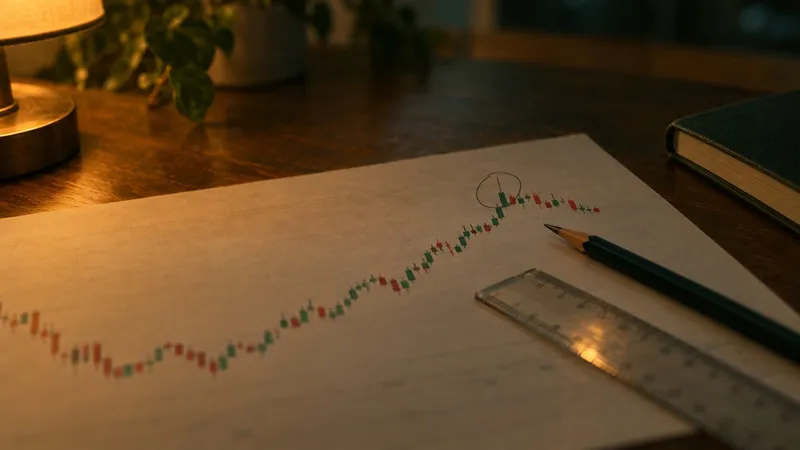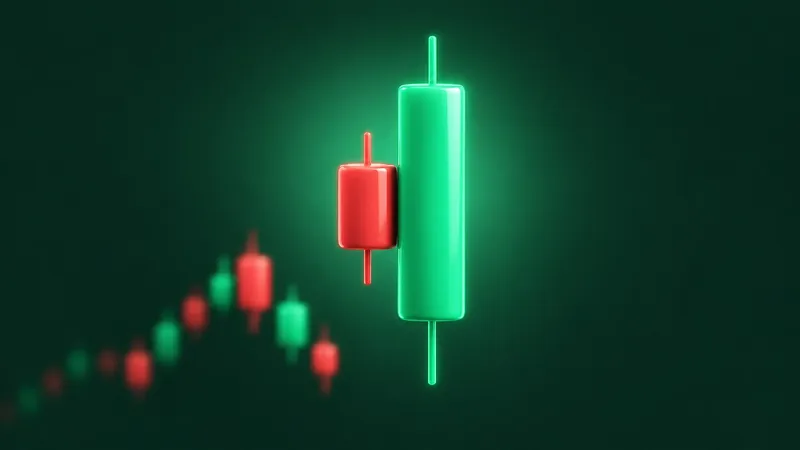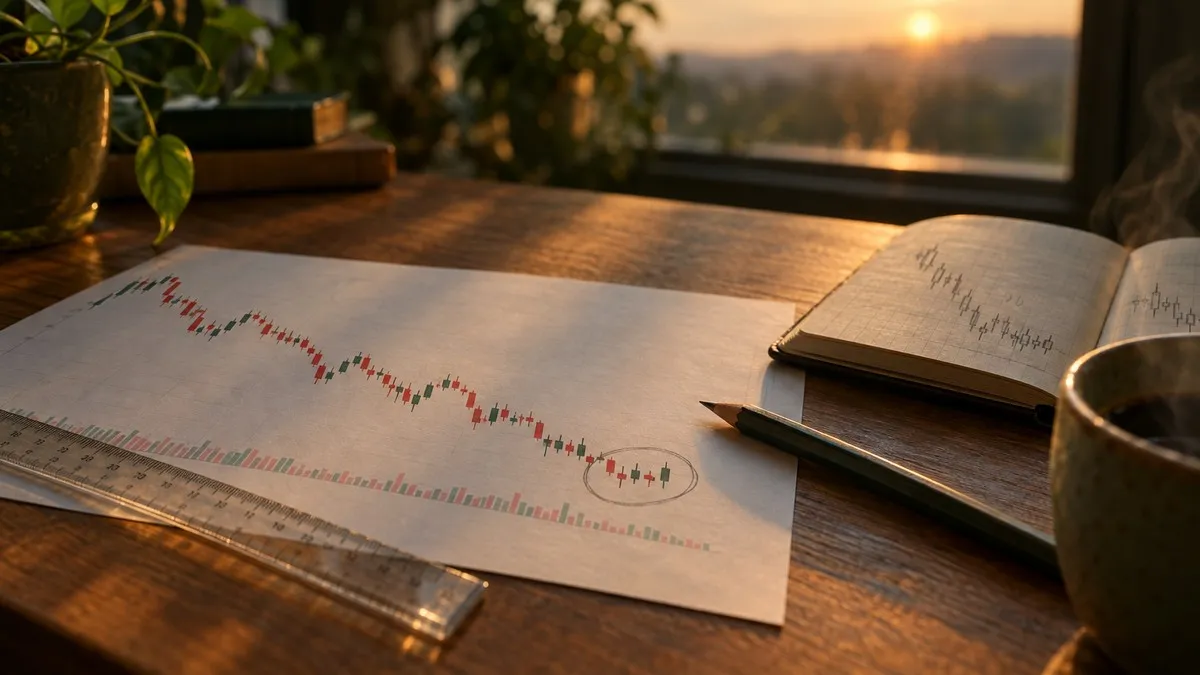
A morning star candlestick is a three-candle bottom reversal pattern: a tall red candle extending a decline, a small-bodied candle that sits below it, and a tall green candle that closes at least halfway back into the first one. Of the three, the small middle candle carries the idea. It is the session where selling stopped working, and whether it really counts as a star decides whether you are looking at a morning star or at three random days.
You have probably seen one on a chart that was falling hard. A big red day, a quiet little candle, then a strong green day, and suddenly every comment calls the bottom. Sometimes it was the bottom. Often the stock drifted sideways for a week and went lower. This post walks through each candle, why the middle one gets the most scrutiny, the doji variant, and what the people who counted thousands of these patterns found.
What a morning star candlestick is
The pattern comes from Japanese rice trading and reached Western traders through Steve Nison's 1991 book Japanese Candlestick Charting Techniques. Nison describes it as a tall black real body, then a small real body that gaps lower, then a white real body that moves well into the first session's black body. Black and white are the old print colours; on most screens today they are red and green.
The StockCharts candlestick dictionary writes the same rule with the gaps spelled out: the middle candle gaps down on the open, the third candle gaps up on the open, and the third closes above the midpoint of the first candle's body.
Read as a story, the three sessions are a change of control:
- Candle one, a tall red body: sellers are in charge and the decline is still running.
- Candle two, the star: a small body, either colour, below the first. Sellers pushed price lower at the open but could not make the move stick.
- Candle three, a tall green body: buyers take back at least half of the ground lost on day one.
If candlesticks are new to you, the guide to reading candlestick charts covers bodies, wicks and colours before you look at three of them together.
The middle candle: what makes it a star
Two of the three candles are easy to spot. A tall red day in a falling stock is ordinary, and a tall green day after it gets noticed by everyone. The middle candle is where two traders looking at the same chart start to disagree.
Body size, not colour
The star's job is to show indecision. A small real body means the open and the close ended up close together, whatever happened in between. The colour of the star does not matter; its size does. Nison says the star's real body can be white or black, and Thomas Bulkowski's identification rule asks for "a small bodied candle of any color."
What a small body rules out is just as useful. If the middle candle has a body nearly as tall as the first one, sellers did not lose momentum; they had another strong day. That is a continuing decline with a bounce after it, not a star.
The gap, and how strict to be
The classic definition asks for a gap between the bodies of candle one and candle two: the star's body sits entirely below the first candle's body. Bulkowski adds a second gap, with the third candle's body above the star's.
Nison himself is relaxed about that second gap. In his words, the ideal pattern has a gap before and after the star, but the second gap is rare, and its absence "does not seem to vitiate the power of this formation." Charting software differs on this too, which is why two scanners can report different counts of morning stars on the same stock.
A practical rule: look for the first gap between bodies, and treat the second as a bonus. On a daily stock chart, the star's body sits below the first body when the stock opens under the prior close and the whole session stays there, open and close alike. A gap between the wicks as well, with no overlap at all, is a stricter reading than most definitions ask for.
Morning doji star: when the middle candle has no body
When the star is a doji, a candle whose open and close are almost equal, the pattern gets its own name: the morning doji star. It is the most extreme form of indecision a middle candle can show. The five doji types each say something slightly different about that indecision, and the same caution applies here: a doji alone is not a signal.
Bulkowski's doji star page reports that the variant acted as a bullish reversal 76% of the time across 932 examples. It is rarer than the plain morning star, ranking 78th out of 103 candlestick patterns for frequency, and he warns that his bear market samples were small, only 33 for one of the four market and breakout combinations he tracks. So the doji version is not clearly better. It is mostly just harder to find.
The third candle and the midpoint rule
The third candle confirms the story. It has to be green, it has to be tall, and it has to close at least halfway into the body of the first candle. The midpoint matters because it measures how much of the selling day the buyers erased.
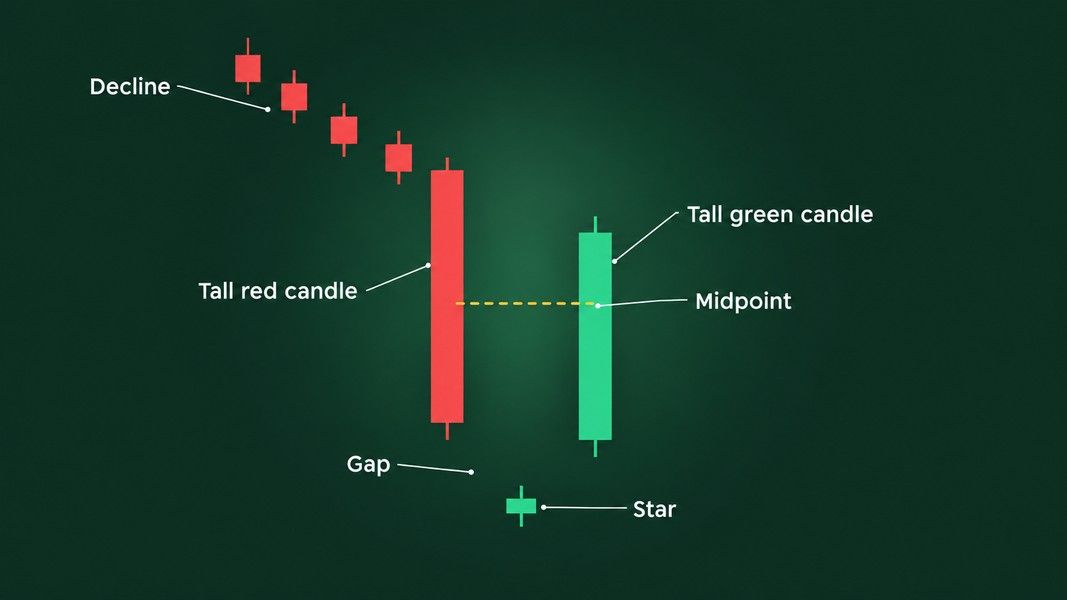
A third candle that closes only a little above the star is a weak bounce. A third candle that closes back above the top of the first red body has erased the whole selling day. Most real examples land somewhere between those two cases, and the midpoint line is the cut-off the definitions agree on.
What the third candle does not tell you is where the move ends. The morning star marks a possible low; it says nothing about how far the bounce runs.
What Bulkowski's numbers say about the morning star candlestick
Thomas Bulkowski tested 103 candlestick patterns for his Encyclopedia of Candlestick Charts, and his morning star results are among the strongest in that set. In his tests, a reversal means price left the pattern in the direction the pattern pointed. These are averages from a past sample of stocks, not a forecast for the next one.
| Measure | Morning star | Morning doji star |
|---|---|---|
| Acted as a bullish reversal | 78% | 76% |
| Reversal rank of 103 | 6th | not stated |
| Overall performance rank of 103 | 12th | 25th |
| Frequency rank of 103 (1 is most common) | 66th | 78th |
| Best share meeting his price target | 49% | 49% |
Two details on that page change how you would read a morning star in practice. First, after an upward breakout the pattern was the weakest performer if you measure only ten days later, while the move measured to the end of the trend held up better. Bulkowski's own summary is that the trend "takes a while to get going." Second, his best 10-day figure rests on just 108 patterns, well short of the thousands of samples he prefers, and he expects it to shrink as more data arrives.
Where the pattern did best
The same page lists three conditions where the pattern did best in his sample:
- It formed within a third of the yearly low.
- The candles were tall rather than small.
- It appeared in a downward retrace inside a larger uptrend, a pullback rather than a collapse.
The last one is the most useful filter. A morning star after a dip in a stock that was already rising is a different situation from one in the middle of a long slide.
Where the morning star fails
The pattern needs something to reverse. Three candles shaped like a morning star in the middle of a sideways range are not a bottom; there was no decline for the star to end. This is the most common misread, because a scanner checks the shape and rarely checks the trend before it.
The second failure is size. A small red candle, a tiny star and a small green candle can tick every box on paper while describing three quiet days. Bulkowski's own tip points the same way: tall candles did better than short ones in his data.
The third failure is the wait. Because the move after a morning star tends to start slowly, a reader expecting an instant rally often decides it failed after three days, right before the stock moves. Or it never moves, and the next red candle closes below the star's low. That low is the natural level to watch: once price closes beneath it, the reading the pattern offered no longer holds.
The candlestick patterns cheat sheet puts the morning star beside the other reversal patterns, which helps when a shape on the chart could be read two ways.
What the academic tests found
Candlestick research is split, and the split is instructive. A 1998 study by Caginalp and Laurent tested three-day candlestick patterns on the daily prices of all S&P 500 stocks from 1992 to 1996. Out of sample, they found a statistically significant effect, with price moving almost 1% in the pattern's direction over a two-day holding period.
Later work on Dow Jones stocks found the opposite, and a 2015 paper in the Journal of Banking and Finance asked why. Testing eight three-day reversal patterns on the DJIA components, the authors found the patterns held up after a 0.5% transaction cost and a data-snooping check when positions were closed after a few days, and did not when they were held for a fixed ten-day window. The holding rule decided the result more than the definition of trend did.
Put that next to Bulkowski's slow start and you get an honest summary: the morning star shows a measurable tendency in past samples, and how much of it a reader sees depends on rules the pattern itself does not supply.
Evening star: the same three candles upside down
The evening star is the mirror image at the top of an advance: a tall green candle, a small star above it, and a tall red candle that closes at least halfway down into the first body. Everything above about the middle candle applies in reverse. A star with a large body is not a star, a pattern with no rally before it has nothing to reverse, and the third candle's close against the midpoint of the first is the line that separates a pattern from a pause.
That is why the two are usually learned together as the morning star and evening star candlestick pattern: once you can read one, you can read the other.
Reading a morning star from a chart photo
Spotting the pattern is the easy part. Judging the context around it, the decline before it, the size of the candles and where it sits against the year's range, is where a second read helps.
Primo Trade's Analyze Chart reads a photo or screenshot of a chart: the trend, volatility, volume and sentiment, the chart pattern it sees and what that pattern usually signals. It reads only what is in the frame, so a screenshot that cuts off the decline before the star gives the AI less to work with than one that shows the whole slide. Primo Trade gives AI-generated analysis for information and education. It is not financial advice. Markets carry risk; do your own research before you trade.
From a ticker instead, Primo Trade pulls prices, news and financial metrics for a US-listed stock and gives a signal, a Primo Score, a Trading Strategy idea and Key Insights, which puts a three-candle pattern next to what the numbers and the news say about the same stock.
The short version
A morning star is three candles: a tall red one in a decline, a small star below it, and a tall green one that closes past the middle of the first. The middle candle decides whether the pattern exists at all. Its body has to be small, its colour does not matter, and the gap below the first body is the version of the rule you will meet most on stock charts.
In Bulkowski's sample the pattern acted as a bullish reversal 78% of the time and did best near the yearly low, with tall candles, as a pullback inside an uptrend. Academic tests agree there is a tendency in past data and disagree about how much of it survives, depending mostly on how long a position was held. The pattern marks a possible low. It does not say how far the next move goes, and a close below the star's low ends the reading.