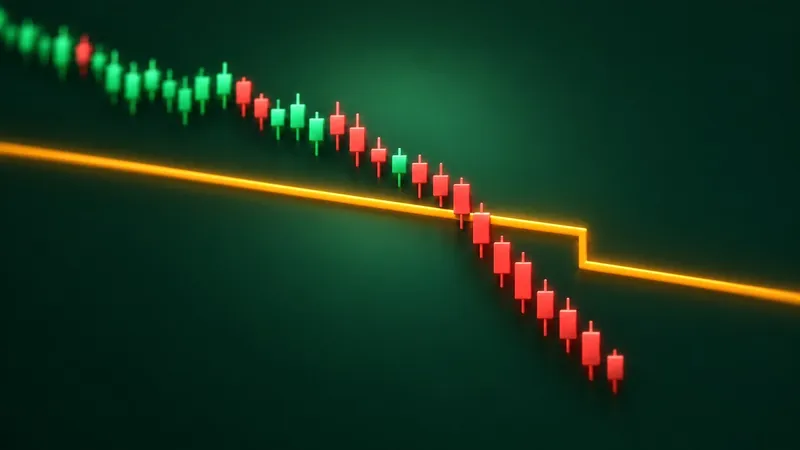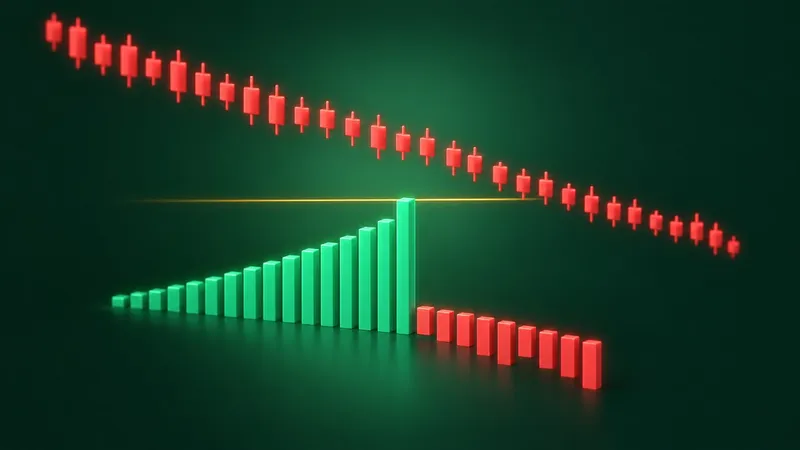
Five trades, each set up at a tidy 1 to 3: risk $2 a share to aim for $6. Four of them hit the stop. The fifth reached its target, and the account still finished $2 a share lower than where it started. Nothing went wrong with the arithmetic. The plan simply asked for more than the ratio can deliver.
A risk to reward ratio compares what a trade loses if price reaches your stop with the move you are aiming for if price reaches your target. It tells you the size of each outcome. It says nothing about how often either one happens, and that missing half is where good-looking trades quietly bleed.
This post walks through how to calculate the ratio, the hit rate each ratio needs just to break even, and the four reasons a 1 to 3 setup can still lose over a run of trades.
What a Risk to Reward Ratio Measures
Every planned trade has three prices: the entry, the stop where the idea is wrong, and the target where you plan to exit. The risk is the distance from entry to stop. The reward is the distance from entry to target. The ratio puts one beside the other.
The 1 to 3 figure is everywhere for a reason. Investopedia's definition says market strategists often find the ideal ratio to be about 1:3, and a Schwab trading plan video says many traders only enter when every dollar at risk has the potential to bring back $3 or more. The same video adds that some traders lose more often than not and still come out ahead. That second sentence is the whole point of this post, and it only holds when the hit rate cooperates.
Which number comes first
Conventions differ. "1 to 3" usually means one unit of risk for three of reward. Some traders flip it and say "3 to 1 reward to risk", or write a single multiple such as 3R. All three describe the same trade. Check which order a source uses before comparing its numbers with yours.
How to Calculate Risk Reward Ratio
For a long trade:
- Risk per share is entry minus stop.
- Reward per share is target minus entry.
- The ratio is risk divided by reward, written as 1 to (reward divided by risk).
Take a hypothetical stock bought at $50, with a stop at $48 and a target at $56. The risk is $2, the reward is $6, and the ratio is 1 to 3. For a short trade the subtractions flip: risk is stop minus entry, reward is entry minus target.
Share count changes the dollars but not the ratio. Buy 100 shares and you risk $200 to aim for $600; the ratio stays 1 to 3. The ratio is fixed by where you put the stop and the target, nothing else. That makes it easy to improve on paper: slide the target up or the stop closer, and the number looks better without the trade getting any better.
Investopedia's own entry on the risk/reward ratio notes that a trader can adjust the ratio with a stop-loss order. Moving the stop changes the number. Whether the market respects that stop is a separate question, covered below.
The Hit Rate Each Ratio Needs
Here is the part the ratio leaves out. For a trade to break even over many attempts, the target has to be hit often enough that the rewards cover the stops. The share of trades that must reach the target is 1 divided by (1 plus the reward multiple).
| Risk to reward ratio | Reward multiple | Target hits needed to break even |
|---|---|---|
| 1 to 1 | 1 | 50% |
| 1 to 2 | 2 | 33% |
| 1 to 3 | 3 | 25% |
| 1 to 4 | 4 | 20% |
A 1 to 3 setup can fail three times in four and finish flat. That is the appeal. It is also the trap, because the 25% has to be real, measured over many trades, and it has to survive every cost.
The five-trade story at the top hit its target once in five, 20%, below the 25% a 1 to 3 trade needs. A ratio that looks generous on each trade still adds up to a loss across them.
Why a 1 to 3 Trade Can Still Lose
Four things push the needed hit rate up or the real hit rate down. Most losing runs at a good-looking ratio come from one of them.
A farther target gets hit less often
The farther away a target sits, the less often price gets there before it touches the stop. Probability theory puts a number on the simplest case. In a random walk with no drift, where each step up is as likely as each step down, the chance of reaching a level a above the start before a level b below it is b divided by (a plus b). The result comes from the classic gambler's ruin problem, and Columbia's stochastic processes notes apply it to a stock price modelled as a simple random walk.
Plug in a 1 to 3 trade: a target 3 units up, a stop 1 unit down. The chance of reaching the target first is 1 divided by 4, which is 25%. That is exactly the break-even rate from the table. In a market with no edge, the ratio buys you bigger rewards and charges you for them in fewer hits, to the cent.
Real prices are not a coin toss, so this is a baseline rather than a forecast. It does show where any advantage has to come from: a reason to expect price to reach the target more often than chance would. The ratio cannot supply that reason. Only the setup can.
The stop does not fill at the stop price
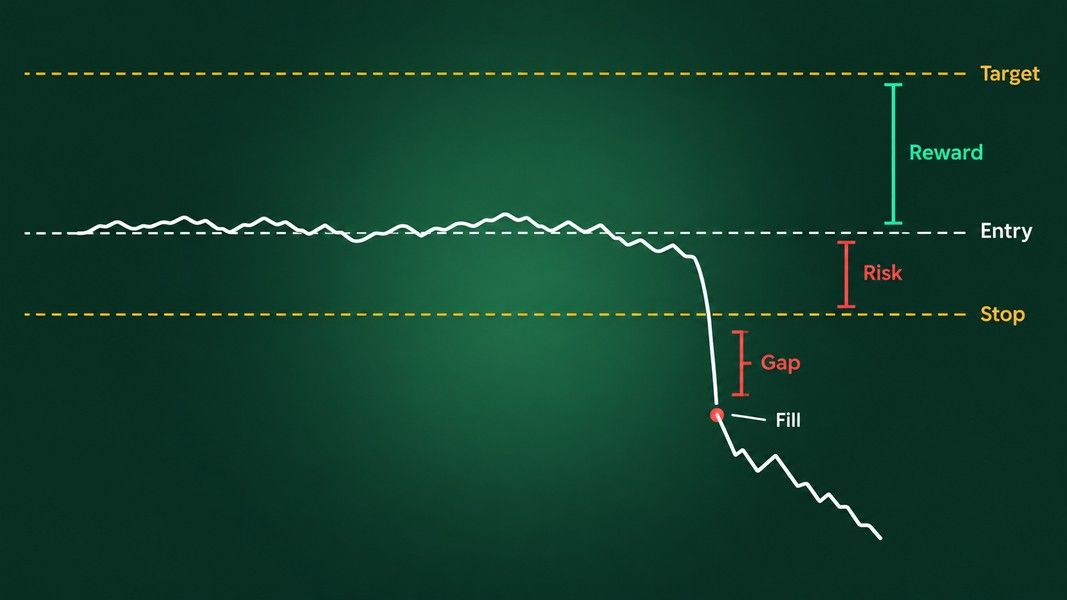
The ratio assumes you lose exactly the distance to your stop. A plain stop order does not promise that. FINRA's Regulatory Notice 16-19 explains that once a stop is triggered it becomes a market order, and that in a sharp decline a sell stop is more likely to execute well below the stop price.
Go back to the $50 trade. Earnings land after the close, and the stock opens at $46.50. The stop at $48 triggers at the open and fills near $46.50. The loss is $3.50 a share instead of $2. On that trade the realized ratio was 1 to 1.7, which needs the target hit 37% of the time, not 25%.
One gap does not ruin a plan. A habit of holding through earnings or other overnight events does, because every gap lands on the same side of the ledger. A stop-limit order caps the fill price but may not fill at all, a trade-off the guide to stop, stop-limit and trailing stop orders walks through.
Costs shave both sides
Commissions, fees and the bid-ask spread come off the reward and add to the risk. On a $6 target the spread on a liquid stock barely registers. On a target of a few cents it can turn the ratio upside down, which is the math behind scalping's tiny targets. The smaller the planned move, the more of it costs eat, and the higher the hit rate climbs.
The target came from the ratio, not the chart
This is the quiet one. A trader decides on 1 to 3 first, measures three times the stop distance upward, and calls that the target. Price has no idea that line exists. If the nearest resistance sits $3 above entry, a $6 target needs price to clear it, and that is a much rarer event than the ratio implies.
A stop placed by the same logic fails the other way. Set it close to make the ratio look better and ordinary noise taps it out before the idea has been tested. The ratio improves; the hit rate drops by more than the ratio improved.
How to Use the Ratio Without Fooling Yourself
Each cause above has a matching habit.
Place the stop where the idea is wrong, then find the target on the chart. Put the stop beyond the level that would prove the setup failed, look for the first obvious obstacle above for the target, and only then compute the ratio. If it comes out at 1 to 1.2, the honest move is to skip the trade, not to stretch the target.
Price in the gap risk. Ask whether the trade will be open through an earnings date or another scheduled event. If it will, your risk is not the distance to your stop; it is the distance to where a gap could open.
Count costs in the ratio. Subtract the spread and fees from the reward and add them to the risk before comparing ratios.
Expectancy: the number the ratio leaves out
The ratio is only half of an equation. The other half is how often each outcome happens. Expectancy combines them: the hit rate times the average reward, minus the miss rate times the average loss.
Use the $50 trade with a $6 target and a $2 stop. If the target is hit 30% of the time, expectancy is 0.30 × $6 minus 0.70 × $2, which is $1.80 minus $1.40, or 40 cents a share per trade. Now let a few gaps push the average loss to $2.50. The same 30% gives $1.80 minus $1.75: 5 cents. Drop the hit rate to 22% and the result is $1.32 minus $1.56, a loss of 24 cents a share every time you take the setup.
The chart and the ratio were identical in all three cases. Only a record of real trades tells you which case you are in, and it takes many trades before that record means much.
Where an AI Read Fits
A second read of a chart is useful for the part the ratio leaves out: whether the chart behind the setup holds up at all. Primo Trade reads a chart from a photo or screenshot and names the trend, the chart pattern it sees and what that pattern usually signals, and for a US-listed ticker it adds recent news headlines. Its Trading Strategy section gives a style such as Swing Trading or Avoid, a risk level and two or three action points as text.
Primo Trade gives AI-generated analysis for information and education. It is not financial advice. Markets carry risk; do your own research before you trade.
Two honest limits. Primo Trade does not calculate a risk to reward ratio or a position size; the entry, stop and target stay yours to set. And the Forecast Value on a ticker analysis is the model's 6 to 12 month estimate, not a target to drop into the formula above. Using it as one would mean pairing a short-term stop with a year-long guess.
The Short Version
A risk to reward ratio tells you the size of the bet, not the odds. A 1 to 3 trade needs its target hit at least one time in four, and in a market with no edge it gets hit exactly that often, which leaves nothing over. Gapped stops, costs and targets placed beyond real resistance all push the needed hit rate higher or the actual one lower.
Set the stop where the idea fails, read the target off the chart, include costs and gap risk, and judge the setup by expectancy across many recorded trades. The ratio is a filter for which trades are worth considering. It was never a reason on its own to take one.