You see the RSI indicator print 74 on a stock you own. The word on the chart is "overbought", so you sell. Then the stock keeps climbing for another four weeks, and the RSI never drops back below 70 long enough to let you back in at a better price.
That is the most common way the RSI misleads, and it comes from reading the scale as a warning light. The RSI indicator measures how large recent up closes were against recent down closes, on a scale from 0 to 100, so a reading above 70 says momentum is strong, not that a top is in. This post shows what the number is made of, a dated case where overbought lasted a month, a lookalike where it did mark a top, and what the best-known tests of the 30 and 70 rule found.
What the RSI Indicator Actually Measures
The Relative Strength Index was introduced by J. Welles Wilder in his 1978 book, New Concepts in Technical Trading Systems. He built it on 14 periods, which on a daily chart means the last 14 closes, and 14 is still the default on most charting platforms.
The idea is simple once the jargon is gone. Over those 14 periods, the indicator averages the size of the up closes and the size of the down closes. It divides one by the other to get RS, the relative strength, and then squeezes that ratio onto a 0 to 100 scale.
The RSI Indicator Formula
The formula, as StockCharts lays it out on its ChartSchool page, has two lines:
RS = average gain / average loss
RSI = 100 - 100 / (1 + RS)
The first average is a plain 14-period average. After that, each new average is the previous one times 13, plus today's move, divided by 14. That smoothing is why the RSI moves gradually rather than jumping with every candle, and why one big day changes it less than you might expect.
Two things follow from the math. The RSI has no idea where the price is, only how it got there. And it never looks at volume, news or the trend on a longer timeframe. It is a speedometer, not a map.
What 70 and 30 Mean in Plain Numbers
Wilder called readings above 70 overbought and below 30 oversold. Those words carry a lot of baggage. Turn the scale back into the ratio it stands for and the baggage falls away.
| RSI reading | Average up close divided by average down close | In plain terms |
|---|---|---|
| 20 | 0.25 | Down closes four times the size of up closes |
| 30 | 0.43 | Down closes about 2.3 times the up closes |
| 50 | 1.00 | Up and down closes the same size |
| 70 | 2.33 | Up closes about 2.3 times the down closes |
| 80 | 4.00 | Up closes four times the size of down closes |
Read that way, an RSI of 70 is a description of the last three weeks: the up days have been bigger than the down days by a wide margin. That is what a healthy uptrend looks like. Nothing in the number says the next three weeks have to look different.
The labels "overbought" and "oversold" are interpretations added on top of a ratio, and the ratio itself makes no prediction. Wilder's own levels were meant for markets that swing back and forth. In a market that keeps going one way, the scale behaves differently.
Why Overbought Can Stay Overbought: Nvidia in June and July 2025
A clean, dated case comes from a Charles Schwab education piece published on October 14, 2025. Looking at a daily Nvidia chart, it notes that the 14-day RSI "spent a month almost entirely above 70 in June and July 2025. Meanwhile, the price rose 13%."
The same piece spells out the cost of reading 70 as a signal. Anyone who sold on the first overbought print missed the rest of that move, and anyone who treated 70, or the first dip below it, as a reason to short the stock lost money. The Schwab article sums it up plainly: markets can stay overbought or oversold for days or weeks, and the readings are not buy or sell signals.
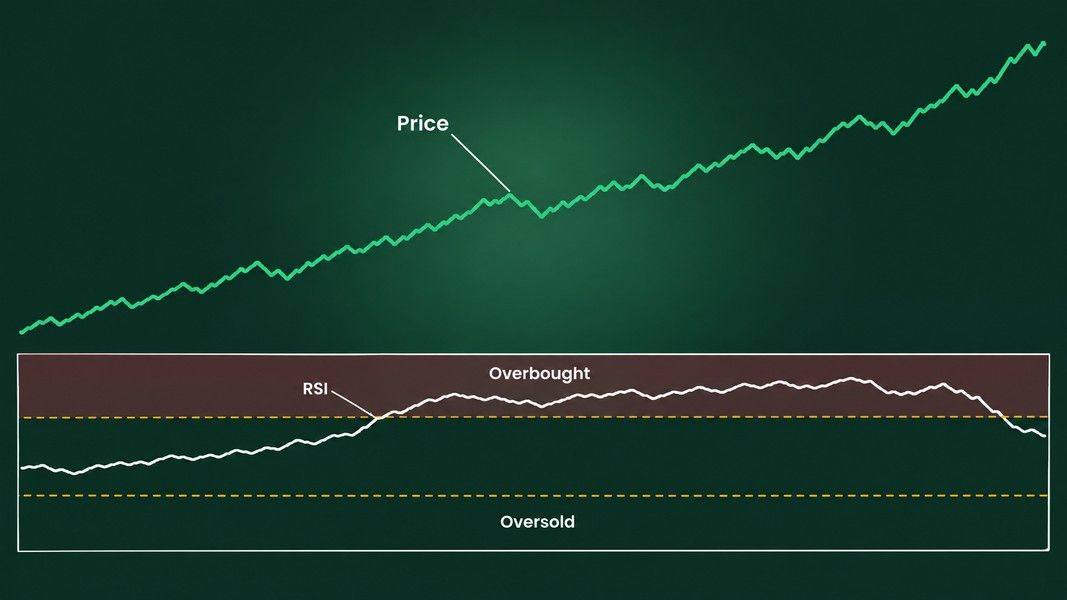
Nothing about that stretch was mysterious. A stock with steady buying closes up more often, and by more, than it closes down. The ratio stays high, so the RSI stays high. The indicator was doing its job; the label was what misled.
What the Strong-Trend Case Looks Like
StockCharts made the same point in an October 2025 article on overbought readings, using the iShares Silver Trust: after a breakout in June, its RSI kept pushing above 70 while price climbed, and each dip under 70 was met with support. Several overbought readings bunched together in an uptrend, in that reading, pointed to strength rather than exhaustion.
That is the pattern to recognise. One reading above 70 after a long flat stretch is a different situation from a stock that keeps tagging 70 week after week.
When Overbought Did Mark a Top: Tesla in December 2024
The lookalike matters as much as the clean case, because sometimes 70 really was the end of the run.
In a technical note on May 16, 2025, Seeking Alpha reported Tesla's RSI at 71.4 and looked back at the previous time it had been above 70. That was in December 2024, when the stock touched an all-time high of $479 and then fell back. By March 2025 the RSI had dropped below 30.
So the same reading, above 70, sat in front of a month of further rises at Nvidia and in front of a decline at Tesla. Looking at the RSI alone, at the moment it crossed 70, you could not have told the two apart. What separated them came later: whether price kept making higher highs, and whether the RSI kept pace with them.
That is the honest limit of the indicator. It describes the move so far. Which of the two stories you are in is something only the following weeks reveal.
Bull and Bear Ranges: Reading the RSI Inside a Trend
Andrew Cardwell, a trader who teaches his own RSI methods, worked around the 70 and 30 problem by moving the goalposts. In a 2012 MoneyShow interview, he described his range rules: in an uptrend he watched 80 and 40, and in a downtrend he found the RSI tended to top out just below 60, so he used 60 and 20.
In practice that turns the question around. Instead of asking "is it above 70?", you ask "where do the pullbacks stop?"
What a Bull Range Looks Like
In a strong uptrend, the RSI tends to spend its time between about 40 and 80. Dips that stall near 40 to 50 and turn back up are the trend catching its breath. A drop that slices through 40 and keeps going is the first sign the range itself has changed.
What a Bear Range Looks Like
The mirror holds in a downtrend. Bounces stall in the 50 to 60 area and the lows reach down toward 20. An "oversold" reading of 28 in a stock that has been in a bear range for months says the selling continues, not that it has finished.
Schwab's article notes the simpler version of the same idea: some traders raise their thresholds to 80 and 20 when the trend is strong. Neither the ranges nor the wider thresholds come with a measured success rate, so treat them as a way of reading context rather than a rule that has been tested to work.
RSI Divergence: A Warning, Not a Reversal
Divergence is the other famous RSI signal. A bearish divergence forms when price makes a higher high while the RSI makes a lower high, so the new high came with less force behind it. A bullish divergence is the mirror: a lower low in price with a higher low on the RSI.
It sounds like an early exit sign, and sometimes it is. Cardwell's warning in the same interview is blunt: "divergence is not a reversal signal. It's not the end of a trend." He found the RSI would often run straight through a divergence to a new high and a new momentum high.
StockCharts adds the practical detail. In a strong trend, divergences mislead, and a strong uptrend can print several bearish divergences before any top arrives. A divergence tells you the push is slowing. It does not tell you when, or whether, the trend turns.
A clearer warning combines more than one thing: a divergence, then a break of a level that price had been respecting. That is where reading support and resistance carries more weight than the oscillator underneath it.
What a Test of the 30 and 70 Rule Showed
Thomas Bulkowski, known for his chart pattern statistics, tested Wilder's rule mechanically and published the results on his site. The setup was specific:
- Buy when the 14-day RSI dropped below 30 and then climbed back above it.
- Sell when the RSI rose above 70 and then fell back below it.
- 552 stocks, from January 1990 to May 18, 2008, not all of them covering the whole period.
He waited for the cross back through the line rather than acting on the first touch, for the reason this whole post is about: a stock can keep falling while the RSI is under 30 and keep rising while it is over 70.
The results were mixed in an instructive way. In his year-by-year breakdown, the rule finished ahead of the S&P 500 in 13 of the 19 years, with an average hold of about five months. The drawdowns were severe. One holding, Sonus Networks, fell 98.9% while the test waited for an RSI sell signal, for a loss of 94.7% on that trade. Adding a stop to limit losses hurt the overall result considerably.
That is a past sample of one rule set on one group of stocks, not a result anyone can expect to repeat. What it does show is the trade-off built into the 30 and 70 levels: following them strictly means sitting through moves that look nothing like what "oversold" promises.
Reading the RSI Next to the Chart
The RSI works best as a second line of evidence under the price, never as the first. A practical order of questions:
- What is the trend on the price chart itself? A rising series of highs and lows, a falling one, or a sideways range?
- Which RSI range fits that trend: 40 to 80, 20 to 60, or the full 30 to 70 of a market going nowhere?
- Is there a divergence, and has price confirmed it by breaking a level that mattered?
The first question is the one most people skip, and it is the one the RSI cannot answer. Moving averages are the usual tool for it, and the history behind the golden cross shows how long a trend filter can take to confirm a turn.
Where an AI Chart Read Fits
If you want a second view of the trend before you look at any oscillator, Primo Trade can help with that first question. You take a photo or a screenshot of a chart, and its AI reads the trend, volatility, volume and sentiment, plus the chart pattern it sees and what that pattern usually signals.
The result also carries a Primo Score, five scores from 0 to 100 including a Technical one. It is worth reading those the way this post reads the RSI: a score of 80 out of 100 is a description of what the AI read in the data, not an 80% chance of anything. Primo Trade gives AI-generated analysis for information and education. It is not financial advice. Markets carry risk; do your own research before you trade.
Primo Trade covers US-listed stocks and ADRs, from a ticker or a chart photo, and the decision about what to do with any read, the RSI's or the AI's, stays with you.
The RSI Indicator in Short
The RSI is a ratio of recent up closes to recent down closes, smoothed over 14 periods and drawn on a 0 to 100 scale. A reading of 70 means up closes have been about 2.3 times the size of down closes, which describes a strong move rather than predicting its end.
Nvidia spent about a month above 70 in June and July 2025 while its price rose 13%. Tesla's reading above 70 in December 2024 came at an all-time high that did not hold. The same number sat in front of both outcomes, which is why the trend on the price chart has to come first.
Cardwell's 40 to 80 and 20 to 60 ranges are a way to read the RSI inside a trend, and divergence is a sign of slowing momentum rather than a reversal. Bulkowski's test of the strict 30 and 70 rule on 552 stocks shows what following the levels mechanically involved: long holds and some very deep drawdowns along the way.