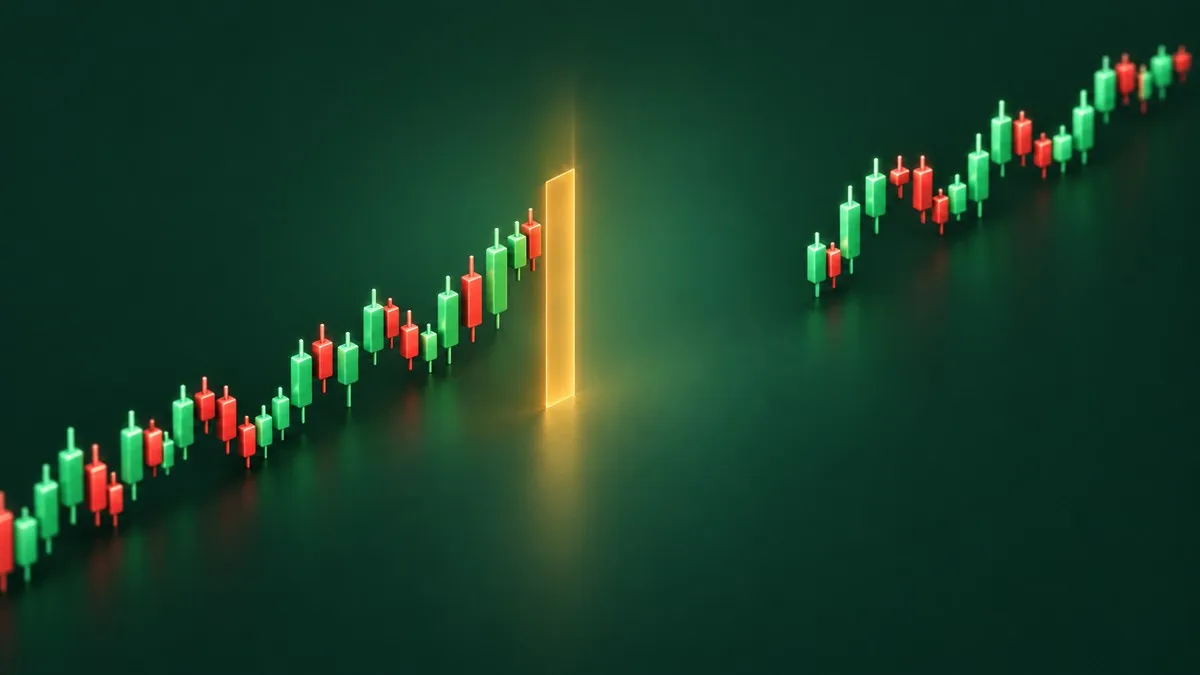
A trading halt is a stop in trading of one stock, or of the whole market, called by an exchange or a regulator so that news can get out or a wild price can be checked. On Monday, June 3, 2024, a share that had closed the previous Friday at about $626,000 showed exactly why the rule exists: Berkshire Hathaway's Class A stock printed at $185.10, down 99.97%, and was halted within moments.
Nothing had happened to Berkshire itself. A software problem had fed bad numbers into the system that decides when a stock should pause, and for a little under two hours the stock simply did not trade.
If you have ever seen "halted" next to a ticker and wondered whether you could still sell, this is the walk through that morning, the rules that froze it, and what a halt means for an order you already placed.
The Morning Berkshire Hathaway Traded at $185
Soon after the opening bell, around 9:45 a.m. Eastern, Berkshire's Class A shares showed a price of $185.10. According to The New York Times, that Friday close against a $185.10 print was a drop of 99.97%. Trading in the stock was halted right away.
Berkshire was not alone. Barrick Gold was shown down 98.54% at one point, and the exchange reviewed trades in about 40 securities, including Chipotle and NuScale Power. Berkshire's Class B shares, like most stocks that day, traded normally.
Less than two hours later the halt was lifted, and Berkshire's Class A shares closed the day at $631,110, up 0.6%. A stock that had looked wiped out at 9:50 finished the session higher than it started.
The cause sat outside the stock entirely. The Consolidated Tape Association, which runs the feed that carries NYSE-listed prices, said there had been an issue with the limit up-limit down price bands between 9:30 and 10:27 a.m. As CNBC reported, it pointed to a new software release and said it would switch back to the previous version for the next session.
Why the Trading Halt Kicked In: Limit Up-Limit Down
Most single-stock halts you will ever see are not decisions by a person. They come from the Limit Up-Limit Down plan, usually shortened to LULD, which the SEC approved as a pilot in 2012 and made permanent in 2019.
The idea is simple. Every listed stock has an upper and a lower price band around a reference price, the average trade price over the previous five minutes, recalculated as the day goes on. Trades are not allowed outside those bands.
The width depends on the stock. Per FINRA's investor guide, Tier 1 securities, meaning stocks in the S&P 500 or the Russell 1000 and some exchange-traded products, get a band of 5% when priced above $3. Every other listed stock gets 10%. Cheaper shares get wider bands: 20% between $0.75 and $3, and the lesser of $0.15 or 75% below that.
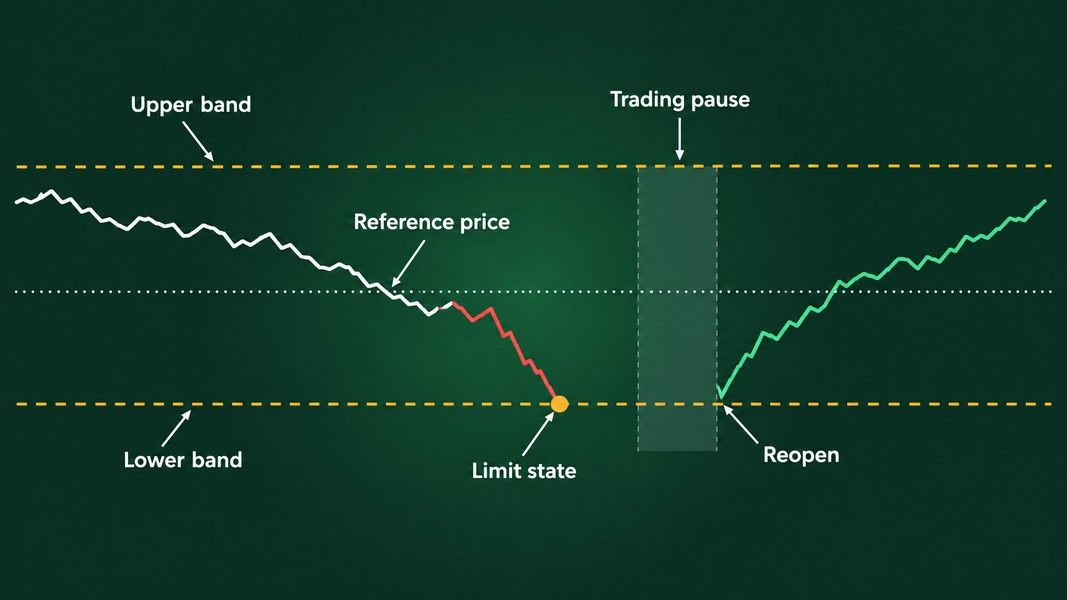
When the price reaches a band, the stock enters a limit state. If it does not move back inside within 15 seconds, the listing exchange declares a five-minute trading pause, and every other venue, off-exchange trading included, has to respect it. The pause can be extended by another five minutes when buy and sell orders are badly out of balance.
What Happened to the Trades: Busted, Not Filled
A halt stops new trades. It does not undo the ones that already printed, so the exchange still had to decide what to do with the Class A trades executed at absurd prices before the pause.
Its answer came the same day. As CNN reported, the NYSE said it would bust, meaning cancel, every erroneous Berkshire trade between 9:50 and 9:51 a.m. at or below $603,718.30. The ruling was not open to appeal, and the exchange said it could cancel trades in other stocks too.
For anyone on either side of those trades, the result was the same: they never happened. A buyer who picked up a share for a few hundred dollars did not keep it, and a seller who was filled at a fraction of the value did not lose it.
That is the part of a halt most traders do not think about. The pause protects the order book for the next few minutes, but a print that already went through can still be reviewed and wiped out afterwards as erroneous. The tape you watched live is not always the tape that stands.
Halted Stock Codes: Five Kinds of Trading Halt
"Halted" on your broker's screen can mean very different things. Exchanges publish a reason code for each one, and Nasdaq's code list is the easiest place to read them.
| Kind of halt | Who calls it | Code you may see | How long it lasts |
|---|---|---|---|
| Volatility pause | Listing exchange, automatically under LULD | LUDP | 5 minutes, extended in 5-minute steps if needed |
| News pending | Listing exchange | T1, then T2 when news is out | Typically under an hour, per FINRA |
| Information requested | Listing exchange | T12 | Until the exchange gets what it asked for |
| SEC trading suspension | The SEC | H10 | Up to 10 business days |
| Market-wide circuit breaker | All markets, on an S&P 500 drop | MWC1, MWC2, MWC3 | 15 minutes, or the rest of the day at Level 3 |
The news-pending halt is the one that feels most dramatic. A listed company has to tell its exchange about material news, such as a merger, a change in its finances or a legal ruling, before it tells the public. The exchange can then halt the stock so that everyone reads the news at the same time rather than whoever happens to be fastest.
An SEC suspension is a different animal. FINRA notes that most of them hit over-the-counter stocks, mostly because the company stopped filing its reports, and that the end of a suspension does not mean the SEC's concerns went away.
Market-Wide Circuit Breakers: When Every Stock Stops
The Berkshire episode was one stock at a time. A market-wide circuit breaker halts everything listed at once, and it is measured against a single number: the S&P 500's fall from the previous day's close.
There are three levels. A 7% fall is Level 1 and a 13% fall is Level 2; either one, before 3:25 p.m., stops all trading for 15 minutes, and after 3:25 p.m. neither stops it. Each of the first two levels can only trigger once a day. A 20% fall is Level 3 and closes the market for the rest of the session, whatever the time.
These are rare. Reuters counted one trigger in 1997 and then four in March 2020, on the 9th, 12th, 16th and 18th, as the pandemic hit. The first came at 9:34:13 a.m. on March 9, when the index crossed the 7% line minutes after the open, and the NYSE working group report on those days says more than 9,000 equity symbols were halted.
A circuit breaker does not stop the fall; it pauses it. On March 9 trading reopened 15 minutes later, the index recovered part of the drop, and it still closed down 7.6%.
What Happens to Your Orders During a Stock Halt
While a stock is halted, FINRA says brokers may not quote it or trade it, on an exchange or off it. Orders you already placed do not vanish: Nasdaq, for one, said during the 2020 halts that resting orders stay on its book unless the customer cancels them, and that it keeps accepting orders in its own listed stocks while they are halted.
The danger is the reopening. A halted stock restarts through an auction, and the price that auction finds can differ sharply from the last trade before the halt, especially when the halt was for news. Two order types behave very differently here.
A stop order turns into a market order once its price is touched, so a stop below the last price can fill well below it if the stock reopens lower. That gap risk is the same one that hits a stop overnight, and it is covered in our guide to stop-loss orders.
A limit order caps the price you accept, so it will not fill at a reopening price worse than your limit. It may also not fill at all, which is the trade-off laid out in the post on why a limit order may not fill.
What a Chart Reader Could Not Know That Morning
This is the part a case study is for. At 9:50 a.m. on June 3, the screen said Berkshire was down 99.97% and halted. Everything that mattered was invisible from there.
You could not tell that the cause was a data feed rather than the company. You could not know that the exchange would later draw a line at $603,718.30 and cancel everything below it, or that the stock would close up on the day. A halt reason code would have told you there was a pause, not whether the prices before it were real.
The chart afterwards is no better a witness. A daily candle shows where the stock opened, traded and closed, not that it stood still for most of a morning, and a reader looking at it weeks later sees an ordinary session.
The same limit applies to any AI read of a chart. Primo Trade's Analyze Chart reads the trend, volatility, volume and chart pattern in a photo or screenshot, and nothing in a chart image says that trading was paused or why. A ticker analysis in Primo Trade adds Recent News, headlines with dates and links, which is where the reason for a news-pending halt usually turns up once it is public.
Primo Trade gives AI-generated analysis for information and education. It is not financial advice. Markets carry risk; do your own research before you trade.
Key Takeaways From the Berkshire Halt
A trading halt is a pause, not a verdict. Berkshire's Class A shares printed at $185.10 on June 3, 2024 because the price bands themselves were wrong, were halted for less than two hours, and closed the day up 0.6%.
Most single-stock halts are automatic LULD pauses of five minutes, triggered when a price hits a band set around its last five minutes of trading. News-pending halts, SEC suspensions and market-wide circuit breakers are rarer and work on their own rules and clocks.
Trades printed before a halt can still be cancelled, as the Berkshire trades below $603,718.30 were. And an order you leave open through a halt meets the reopening price, which is where the difference between a stop and a limit stops being theory.