
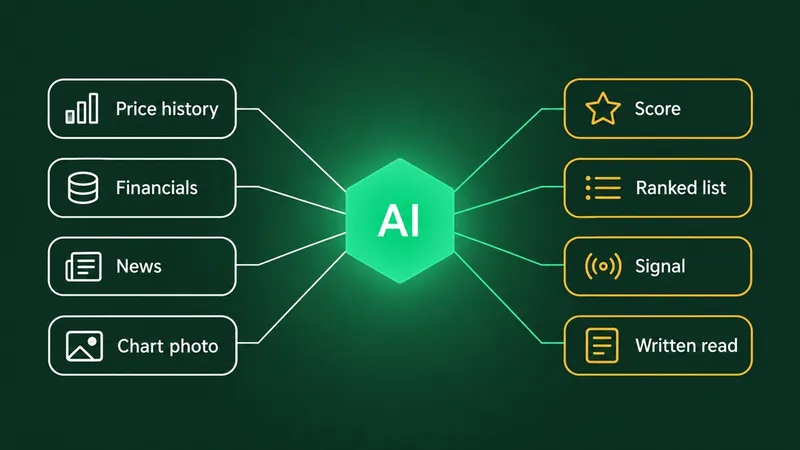
AI Stock Analysis Tools Compared: What Each One Reads
AI stock analysis tools compared by what the AI reads and hands back: scores, scanners, signal feeds and chart-photo reads, each with its catch named.
Older posts, page 4.
AI stock analysis tools compared by what the AI reads and hands back: scores, scanners, signal feeds and chart-photo reads, each with its catch named.
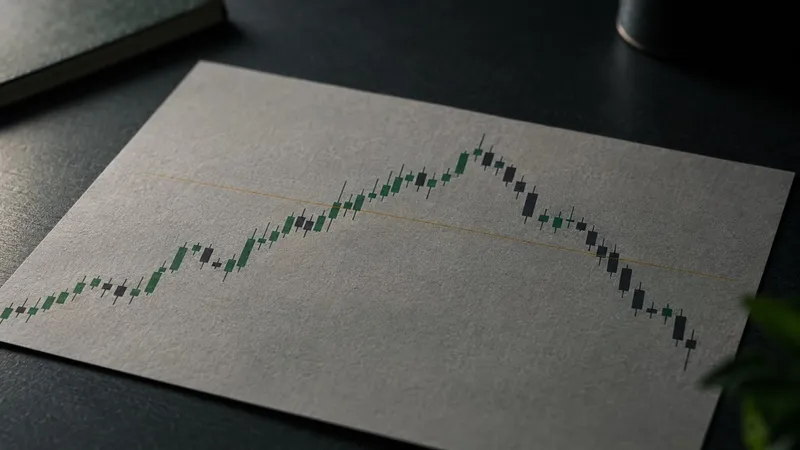
What a stop-loss order does, how stop, stop-limit and trailing stops differ, and why a gap can sell yours far below the stop price or leave it unfilled.
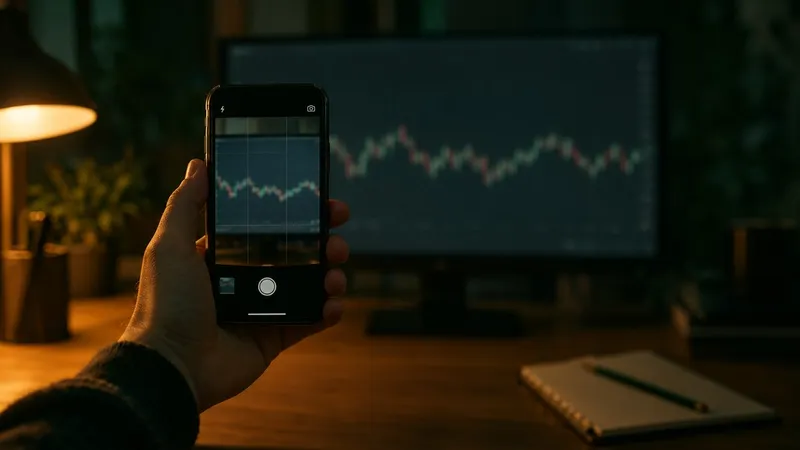
AI chart analysis reads trend, candles and patterns from a screenshot, but not the ticker, the timeframe or the price scale. What it sees, where it slips.
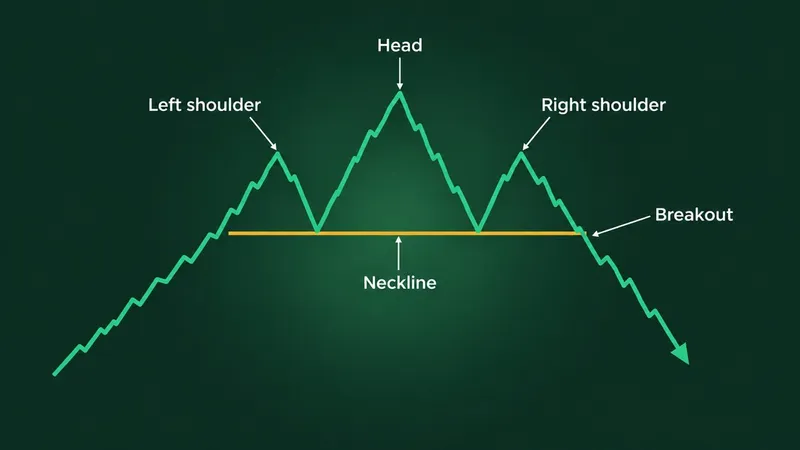
Bullish and bearish chart patterns beside the lookalikes that fool traders, with Bulkowski's failure rates, their samples, and a dated Nvidia example.
How to read candlestick charts: the four prices in every candle, the doji, hammer and engulfing patterns, a real 2010 candle, and what the research found.