

VWAP Indicator: The Line That Resets Every Morning
What the VWAP indicator measures, how to read it on an intraday chart, which settings change it, and why it starts over at every session open.
Older posts, page 2.
What the VWAP indicator measures, how to read it on an intraday chart, which settings change it, and why it starts over at every session open.
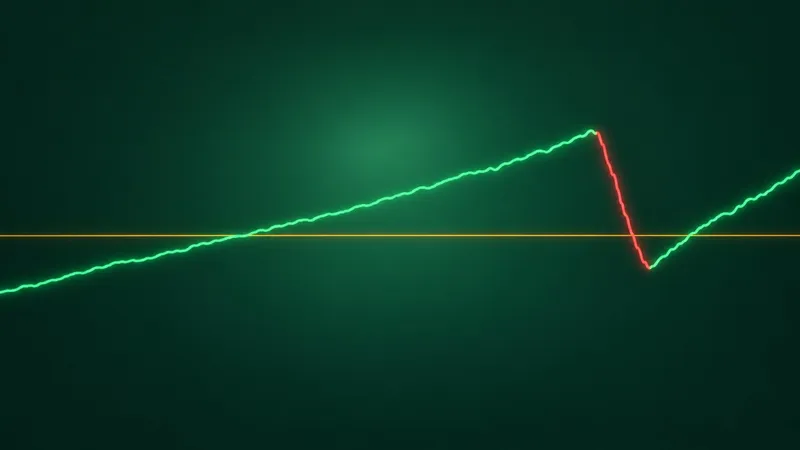
Bull vs bear market history in numbers: how long each lasted, why sources count them differently, and why the label only arrives after the turn.
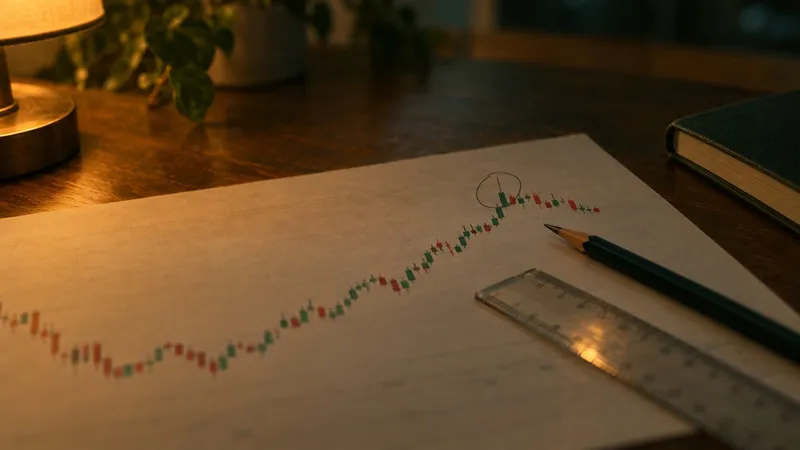
Shooting star candlestick, tested: a bearish reversal 59% of the time, but the gapped two-candle version kept rising 61% of the time. How to tell them apart.
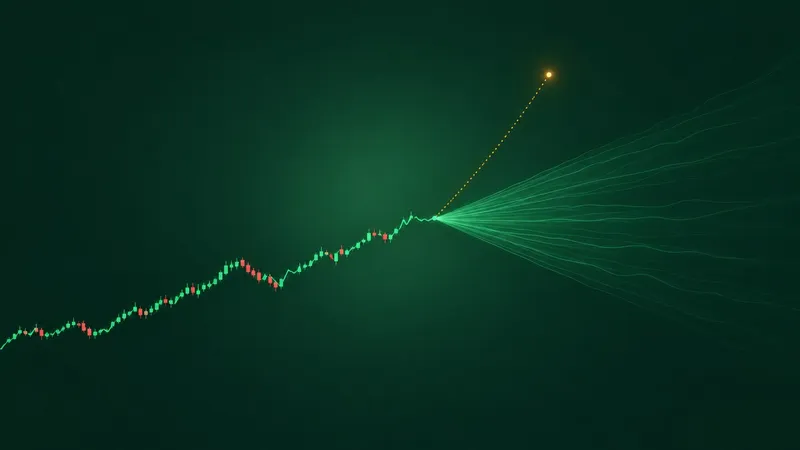
AI stock prediction and analyst price targets both name a future price. What each is built from, how often targets were reached, and how to read both.
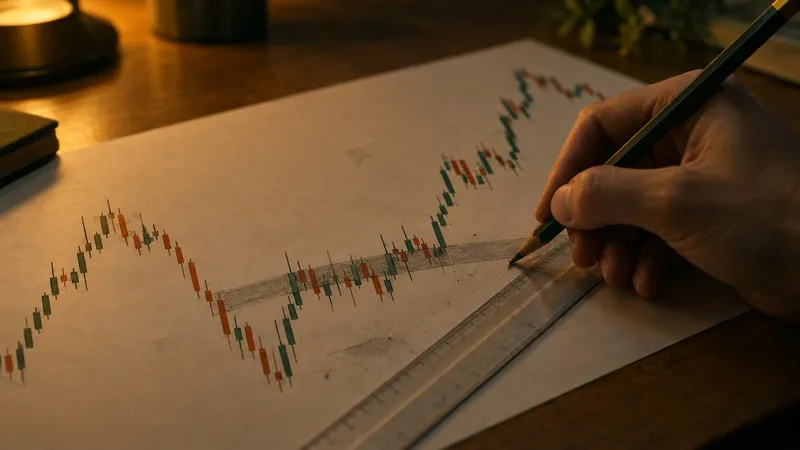
Support and resistance are zones, not lines. Five myths about where price turns, checked against studies of order books, round numbers and breakouts.
A stock buyback read through Apple's May 2024 record: how $110 billion shrank the share count and lifted EPS while net income fell.
A limit order buys or sells at your price or better. How to set one step by step, why it can sit unfilled at your price, and when it fills better.
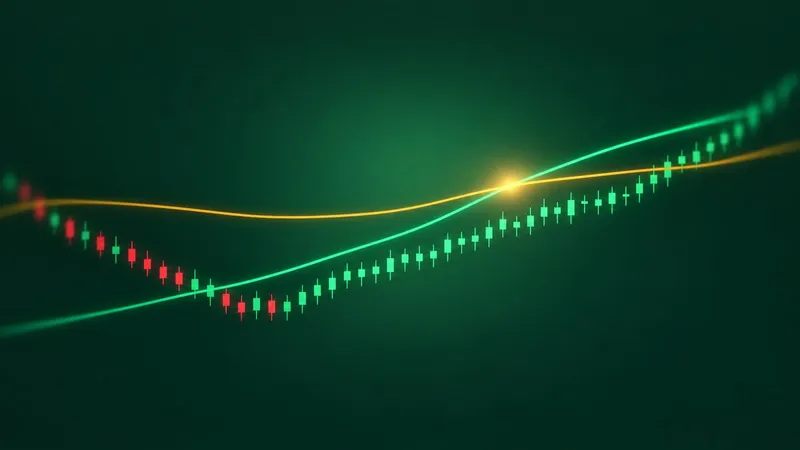
After 31 of 38 golden crosses since 1950 the S&P 500 was higher a year later. After an ordinary day it was higher 74% of the time. What the signal adds.
The free cash flow formula is operating cash minus capital spending. See why Amazon and Netflix reported earnings while free cash flow went negative.
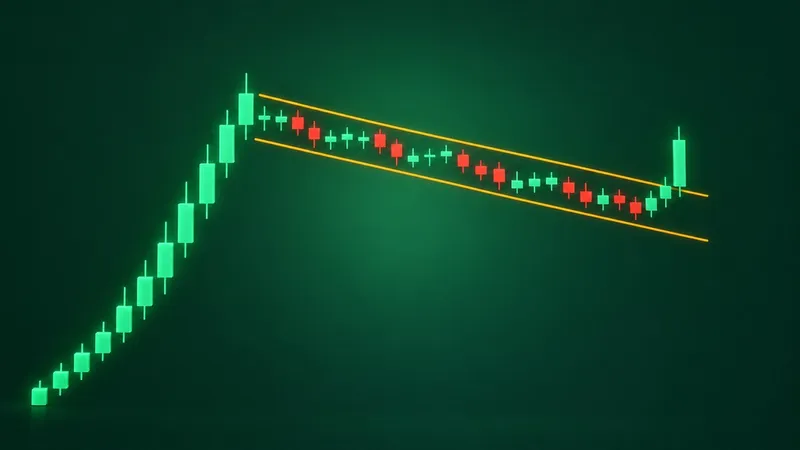
Bull flag vs bear flag: one pause pointed opposite ways. How the pole, slope, volume and break differ, and how often each failed in Bulkowski's data.
The pattern day trader rule and its $25,000 minimum ended in June 2026. What replaced it, the $2,000 floor, intraday margin deficits and cash account traps.

A reverse stock split cuts your share count and lifts the price by the same factor. GE's 1-for-8 in 2021 shows what changed, what did not and what came next.